Once you installed the Icinga, you can monitor the system via web interface; by default it is limited to monitor the local machine where Icinga installed. If you like to monitor the remote Linux box or Windows box, you need to have Nagios plugin and NRPE add-on installed on the remote box. Once installed the plugin and add-on, you need to configure the Icinga server to collect the information from the remote machine and display it on the web interface.
If you are yet to install the Icinga; visit the post of Installing Icinga on Centos 7. Monitoring the Remote Linux system includes the 6 Steps
Icinga Remote Host:
- Add User Account
- Download & Install Nagios Plugin
- Install NRPE Add-on
- Configure NRPE Add-On
Icinga Server Host:
- Configure Icinga Server
- Monitor remote machine.
Icinga Remote Host:
Install the required packages.
yum install gcc cpp glibc-devel glibc-headers kernel-headers libgomp libmpc mpfr make openssl* xinetd
Add User account:
Before proceeding the installation, create a new user in the name of “icinga” and give it a password.
useradd icinga
Set the password.
passwd icinga
Download and Install Nagios Plugin:
Download the Nagios plugins on the remote host using the following command ( For latest version Visit Nagios Website )
cd /tmp
wget http://nagios-plugins.org/download/nagios-plugins-2.0.3.tar.gz
Extract the Nagios plugins tarball.
tar -zxvf /tmp/nagios-plugins-2.0.3.tar.gz
cd /tmp/nagios-plugins-2.0.3
Compile and install the plugin.
./configure --prefix=/usr/local/icinga --with-cgiurl=/icinga/cgi-bin --with-nagios-user=icinga --with-nagios-group=icinga
make
make install
Change the permission of the nagios plugin directory on the remote host.
chown icinga:icinga /usr/local/icinga/
chown -R icinga:icinga /usr/local/icinga/libexec/
Download and install NRPE Add-on:
Visit the Nagios download page and download the NRPE Add-on.
cd /tmp
wget http://downloads.sourceforge.net/project/nagios/nrpe-2.x/nrpe-2.15/nrpe-2.15.tar.gz
Once downloaded, Extract the tar ball.
tar -zxvf /tmp/nrpe-2.15.tar.gz
cd /tmp/nrpe-2.15
Compile it.
./configure --with-nagios-user=icinga --with-nagios-group=icinga --with-nrpe-group=icinga --with-nrpe-user=icinga --prefix=/usr/local/icinga
make all
make install-plugin
make install-daemon
make install-daemon-config
make install-xinetd
Configure NRPE Add-on:
NRPE is the part of the xinetd daemon, modify the NRPE configurations file to accept the connection from the Nagios server, Edit the /etc/xinetd.d/nrpe.
vi /etc/xinetd.d/nrpe
Add the Nagios server ip address like below.
only_from = 127.0.0.1 192.168.12.151
Add NRPE port at the end of the /etc/services file.
nrpe 5666/tcp # NRPE
Restart the Xinetd.d service.
systemctl restart xinetd.service
Confirm that NRPE Listening.
netstat -at | grep 5666
tcp6       0      0 :::5666                 :::*                    LISTEN      26780/xinetd
Confirm the NRPE functioning.
/usr/local/nagios/libexec/check_nrpe -H 127.0.0.1
NRPE v2.15
Modify NRPE Config file:
Modify the /usr/local/icinga/etc/nrpe.cfg on the remote host, it contains the command argument to check the service on the remote host. The nrpe.cfg file contains the basic commands to check the remote services, below are the command lines to check the cpu load and running process. The check_load and check_total_procs has to be entered on template file on the server host to enable the monitoring.
command[check_load]=/usr/local/nagios/libexec/check_load -w 15,10,5 -c 30,25,20
command[check_total_procs]=/usr/local/nagios/libexec/check_procs -w 150 -c 200
In the above command -w stands for warning whereas -c stands for critical alert. For example if you execute the second command on the terminal, it will check the running process; it will warn when the process more than 150 or it will report critical when the process more than 200 and at the same time it will say OK if process below 150.
/usr/local/icinga/libexec/check_procs -w 150 -c 200
PROCS OK: 17 processes | procs=17;150;200;0;
Change warning to 15 and critical to 150 for testing purpose, since process running on the server is very less. Now you can see the warning message, according to your requirement you can modify it.
/usr/local/icinga/libexec/check_procs -w 15 -c 200
PROCS WARNING: 17 processes | procs=17;15;200;0;
Icinga Server Host:
On Icinga server we must have NRPE add-on installed and template of the remote host.
Install NRPE Add-on:
Visit the Nagios download page and download the NRPE Add-on.
cd /tmp
wget http://downloads.sourceforge.net/project/nagios/nrpe-2.x/nrpe-2.15/nrpe-2.15.tar.gz
Once downloaded, Extract the tar ball.
tar -zxvf /tmp/nrpe-2.15.tar.gz
cd /tmp/nrpe-2.15
Compile it.
./configure --with-nagios-user=icinga --with-nagios-group=icinga --with-nrpe-group=icinga --with-nrpe-user=icinga --prefix=/usr/local/icinga
make all
make install-plugin
Configure Nagios Server:
Now its the time configure the Icinga server to monitor the remote client, You’ll need to create a command definition in one of your Icinga object configuration files in order to use the check_nrpe plugin. Edit commands.cfg file.
vi /usr/local/icinga/etc/objects/commands.cfg
Add the following command definition to the file.
# .check_nrpe. command definition
define command{
command_name check_nrpe
command_line $USER1$/check_nrpe -H $HOSTADDRESS$ -t 30 -c $ARG1$
}
Create the new configuration file (/usr/local/icinga/etc/objects/remote.cfg) to define the host and service definition. You can use the following template, modify according to your requirement. The following is configured to display the CPU Load,Disk Space,Current Users. Etc..,
define host{
use linux-server
host_name remote.itzgeek.com
alias Client 1
address 192.168.12.102
}
define hostgroup{
hostgroup_name Linux Client
alias Linux Client 1
members remote.itzgeek.com
}
define service{
use local-service
host_name remote.itzgeek.com
service_description Root Partition
check_command check_nrpe!check_hda1
}
define service{
use local-service
host_name remote.itzgeek.com
service_description Current Users
check_command check_nrpe!check_users
}
define service{
use local-service
host_name remote.itzgeek.com
service_description Total Processes
check_command check_nrpe!check_total_procs
}
define service{
use local-service
host_name remote.itzgeek.com
service_description Current Load
check_command check_nrpe!check_load
}
Add the new template on the icinga.cfg configuration file, so that it will read the new entries.
vi /usr/local/icinga/etc/icinga.cfg
Add below line.
# Definitions for monitoring the Remote (Linux) host
cfg_file=/usr/local/icinga/etc/objects/remote.cfg
Restart the icinga server.
/etc/init.d/icinga restart
Monitor the remote machine:
Now login to the web interface and start do the monitoring. The following screenshot shows the remote Linux server with the default service available.
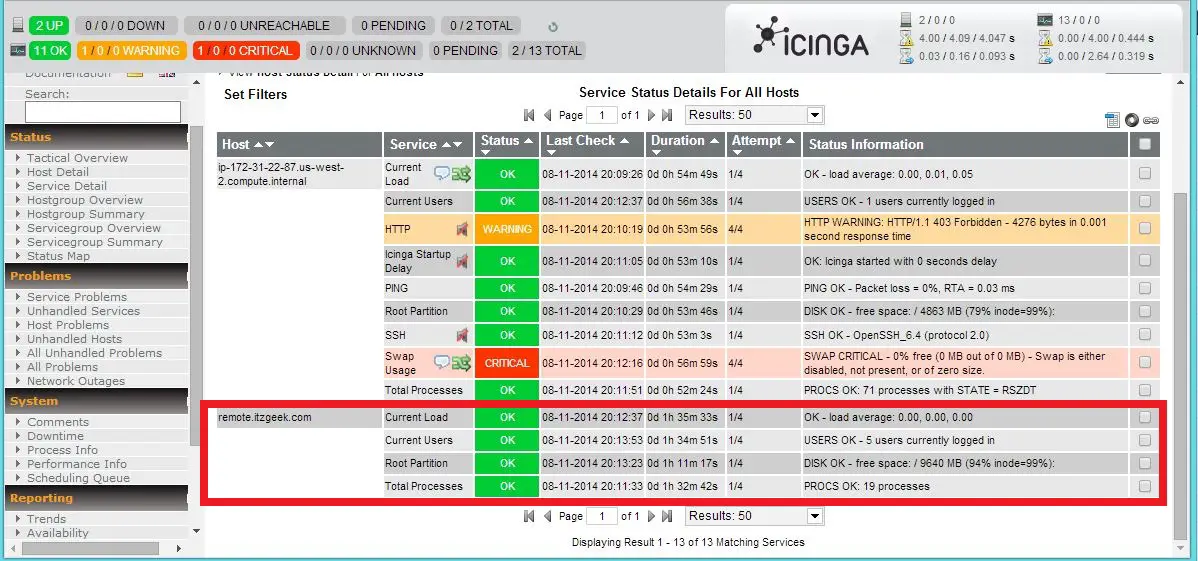
That’s All. Now you can easily monitor the remote machine with Icinga.