ELK stack is a full-featured data analytics platform, consists of Elasticsearch, Logstash, and Kibana open-source tool. It helps you to store and manage logs centrally and gives an ability to analyze the issues.
This article helps you to install ELK stack on Debian 10 / Debian 9.
Install ELK Stack
Elasticsearch – It stores incoming logs from Logstash and provides an ability to search the logs/data in a real-time
Logstash – Processing (Collect, enrich and send it to Elasticsearch) of incoming logs sent by beats (forwarder).
Kibana – Provides visualization of events and logs.
Beats – Installed on client machines, and it sends logs to Logstash or Elasticsearch through beats protocol.
Install Java
Elasticsearch requires either OpenJDK or Oracle JDK available on your machine. Here, for this demo, I am using OpenJDK.
sudo apt update

sudo apt install -y openjdk-11-jre
Check the Java version.
java -version
Output:
openjdk version "11.0.7" 2020-04-14
OpenJDK Runtime Environment (build 11.0.7+10-post-Debian-3deb10u1)
OpenJDK 64-Bit Server VM (build 11.0.7+10-post-Debian-3deb10u1, mixed mode, sharing)
If you want to use OracleJDK, then read:
READ: How to install Oracle Java on Debian 10 / Debian 9
Add Elastic Repository
Install wget and HTTPS support for apt.
sudo apt install -y wget apt-transport-https curl
ELK packages can be obtained from the Elastic repository.
wget -qO - https://artifacts.elastic.co/GPG-KEY-elasticsearch | sudo apt-key add -

echo "deb https://artifacts.elastic.co/packages/oss-7.x/apt stable main" | sudo tee -a /etc/apt/sources.list.d/elastic-7.x.list
Install & Configure Elasticsearch
To begin with, we will now install Elasticsearch server, an open-source search engine based on Lucene. It provides a real-time distributed, multitenant-capable full-text search engine with an HTTP web interface and schema-free JSON documents.
Elasticsearch stores data sent by the Logstash, and it displays them through the Kibana on user’s requests.
Install Elasticsearch using the following command.
sudo apt update

sudo apt install -y elasticsearch-oss
Start the Elasticsearch service.
sudo systemctl start elasticsearch

sudo systemctl enable elasticsearch
Wait for a few minutes and run the following command to see the status of the Elasticsearch REST interface.
curl -X GET http://localhost:9200
Output:
{
  "name" : "debian10",
  "cluster_name" : "elasticsearch",
  "cluster_uuid" : "6y4OcEnYS3qkN_AetQAYMQ",
  "version" : {
    "number" : "7.8.0",
    "build_flavor" : "oss",
    "build_type" : "deb",
    "build_hash" : "757314695644ea9a1dc2fecd26d1a43856725e65",
    "build_date" : "2020-06-14T19:35:50.234439Z",
    "build_snapshot" : false,
    "lucene_version" : "8.5.1",
    "minimum_wire_compatibility_version" : "6.8.0",
    "minimum_index_compatibility_version" : "6.0.0-beta1"
  },
  "tagline" : "You Know, for Search"
}
The above output confirms that Elasticsearch is up and running fine.
Install & Configure Logstash
Logstash is an open-source data-collection and log-parsing engine. It collects logs, parse and store them on Elasticsearch for searching. Over 160+ plugins are available for Logstash, which provides the capability of processing different types of events with no extra work.
sudo apt install -y logstash-oss
The Logstash configuration file consists of three sections, namely input, filter, and the output. You can put all three sections in a single file, or a separate file for each section, end with .conf.
Here, we use a single file for placing input, filter, and output sections. Create a configuration file under /etc/logstash/conf.d/ directory.
sudo nano /etc/logstash/conf.d/beats-syslog.conf
In the input section, we will configure Logstash to listen on port 5044 for incoming logs, from beats (Forwarder) that sit on client machines.
input {
 beats {
   port => 5044
   ssl => false
  }
}
In the filter section, we will use Grok to parse logs ahead of sending it to Elasticsearch, for storing.
The following grok filter will look for labeled logs syslog and tries to parse them to make a structured index.
filter {
if [type] == "syslog" {
    grok {
      match => { "message" => "%{SYSLOGLINE}" }
    }

    date {
match => [ "timestamp", "MMM  d HH:mm:ss", "MMM dd HH:mm:ss" ]
}
  }

}
For more GROK filter patterns, take a look at here.
In the output section, we will define where logs to get stored, obviously Elasticsearch in case of ELK stack.
output {
 elasticsearch {
  hosts => localhost
    index => "%{[@metadata][beat]}-%{+YYYY.MM.dd}"
       }
stdout {
    codec => rubydebug
       }
}
Now start and enable the Logstash service.
sudo systemctl start logstash

sudo systemctl enable logstash
If you face any issue take a look at the Logstash file.
sudo cat /var/log/logstash/logstash-plain.log
Install and Configure Kibana
Kibana provides visualization of data stored on the Elasticsearch. Install Kibana using the following command.
sudo apt install -y kibana-oss
By default, Kibana listens on the localhost which means you can not access the Kibana web interface from another machine. Edit /etc/kibana/kibana.yml file.
sudo nano /etc/kibana/kibana.yml
Make changes to the below line with your server IP address.
server.host: "192.168.0.10"
Start and enable Kibana on machine startup.
sudo systemctl start kibana

sudo systemctl enable kibana
Install Filebeat
Filebeat is a software that runs on the client machine. It sends logs to the Logstash server for parsing or Elasticsearch for storing depends on the configuration.
Install wget and HTTPS support for apt.
sudo apt install -y wget apt-transport-https curl
ELK packages can be obtained from the Elastic repository.
wget -qO - https://artifacts.elastic.co/GPG-KEY-elasticsearch | sudo apt-key add -

echo "deb https://artifacts.elastic.co/packages/oss-7.x/apt stable main" | sudo tee -a /etc/apt/sources.list.d/elastic-7.x.list
Install Filebeat using the following command.
sudo apt update

sudo apt install -y filebeat-oss
The main configuration file of filebeat is /etc/filebeat/filebeat.yml.
sudo nano /etc/filebeat/filebeat.yml
We need to edit this file to send logs to the Logstash server.
Below configurations send syslog (/var/log/syslog) to Logstash server. For this demo, I have commented out /var/log/*.log to avoid sending all logs to the Logstash server.
.  .  .

filebeat.inputs:

# Each - is an input. Most options can be set at the input level, so
# you can use different inputs for various configurations.
# Below are the input specific configurations.

- type: log

  # Change to true to enable this input configuration.
  enabled: true

  # Paths that should be crawled and fetched. Glob based paths.
  paths:
    - /var/log/syslog

.  .  .
In the Outputs section, comment out the section output.elasticsearch: as we are not going to store logs on to Elasticsearch.
Now, go to the line output.logstash: and modify entries to send logs to the Logstash and mention the path to the copied SSL file.
Note: Replace “192.168.0.10” with the IP address of the Logstash server.
.   .   .

#----------------------------- Logstash output --------------------------------
output.logstash:
  # The Logstash hosts
  hosts: ["192.168.0.10:5044"]

.   .   .
Restart the Filebeat service.
sudo systemctl restart filebeat
Access Kibana
You can access the Kibana web interface using the following URL.
OR
On your first login, you need to map the filebeat index. Click Explore on my own to create an index pattern.

Click on the Menu (Hamburger Icon) >> Stack Management >> Index Patterns >> Create index pattern.
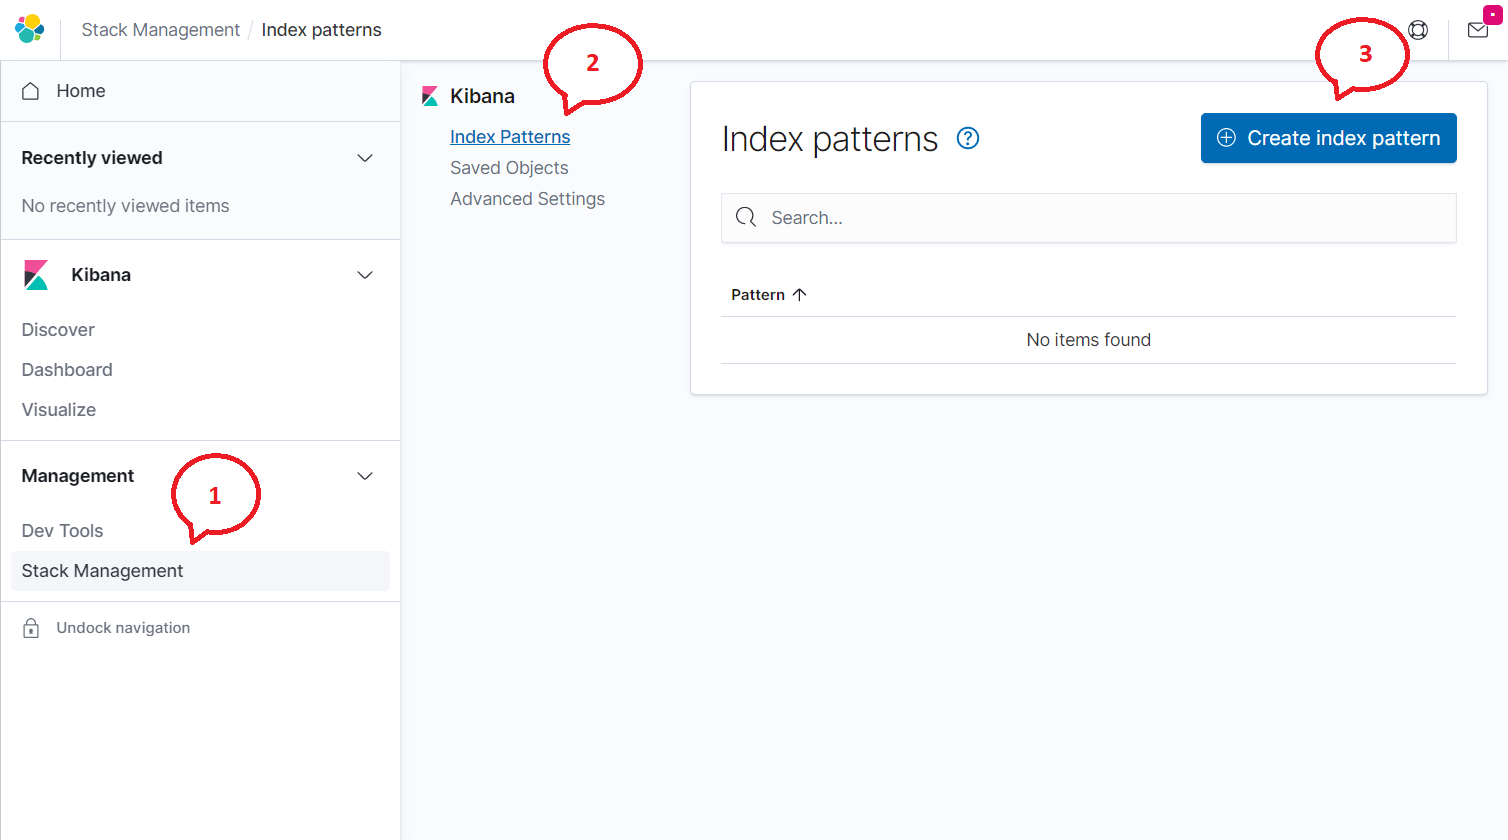
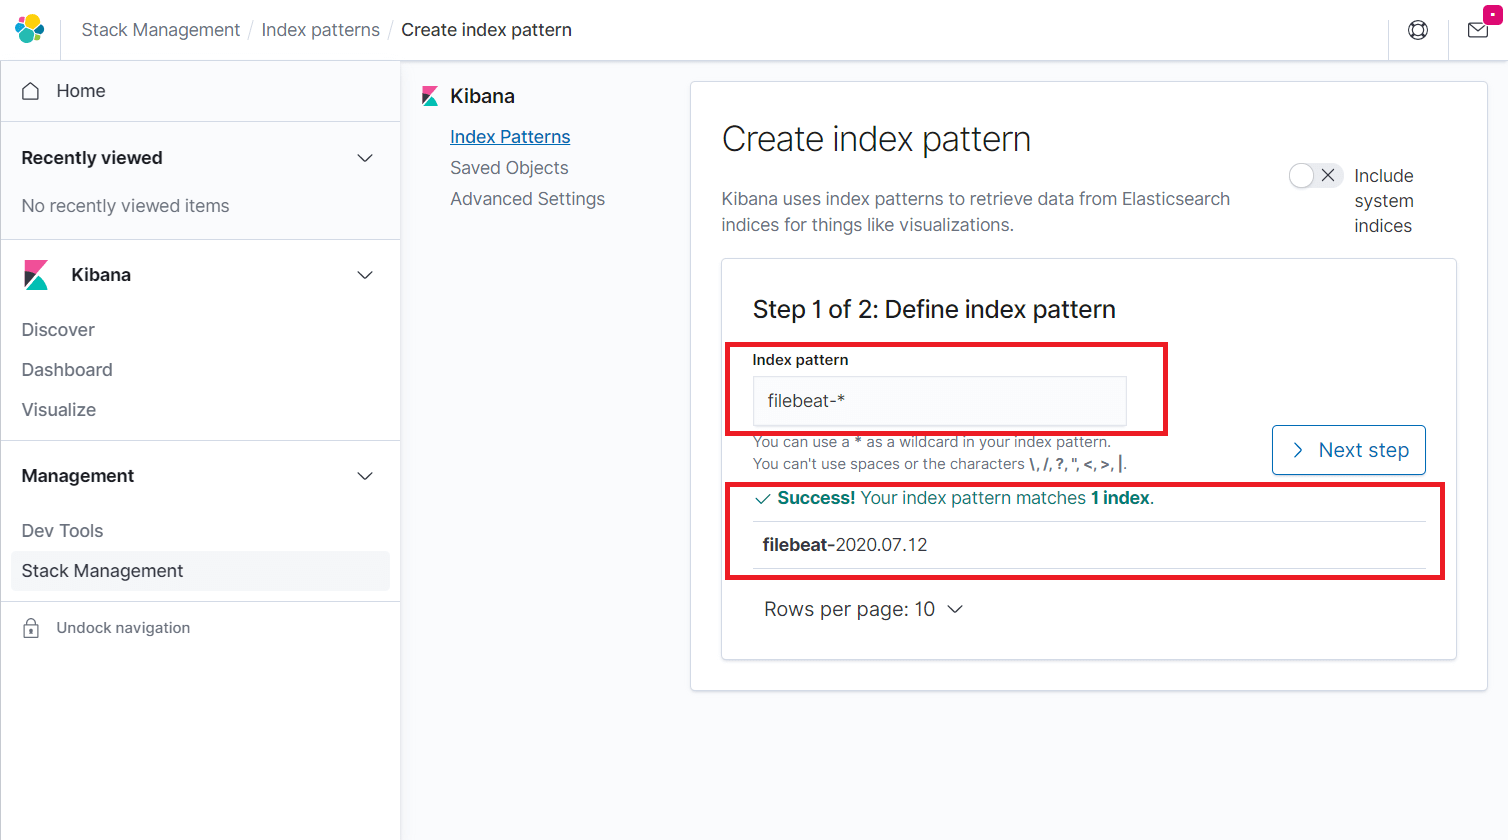
Type the following in the Index pattern box and click the Next step.
filebeat-*
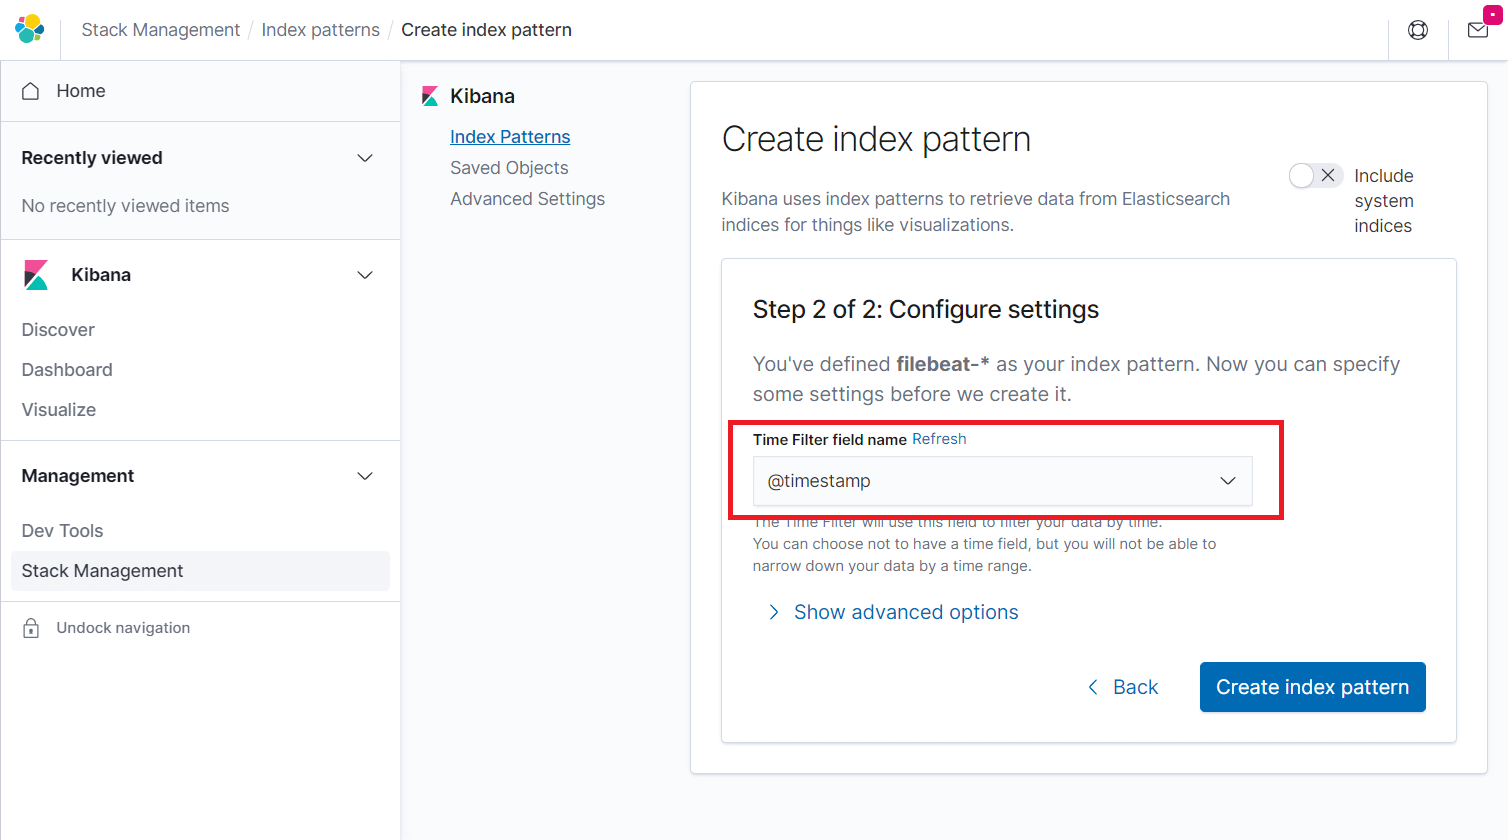
Select @timestamp and then click on Create index pattern.
@timestamp
Go through the fields in the index and their core type recorded by Elasticsearch.
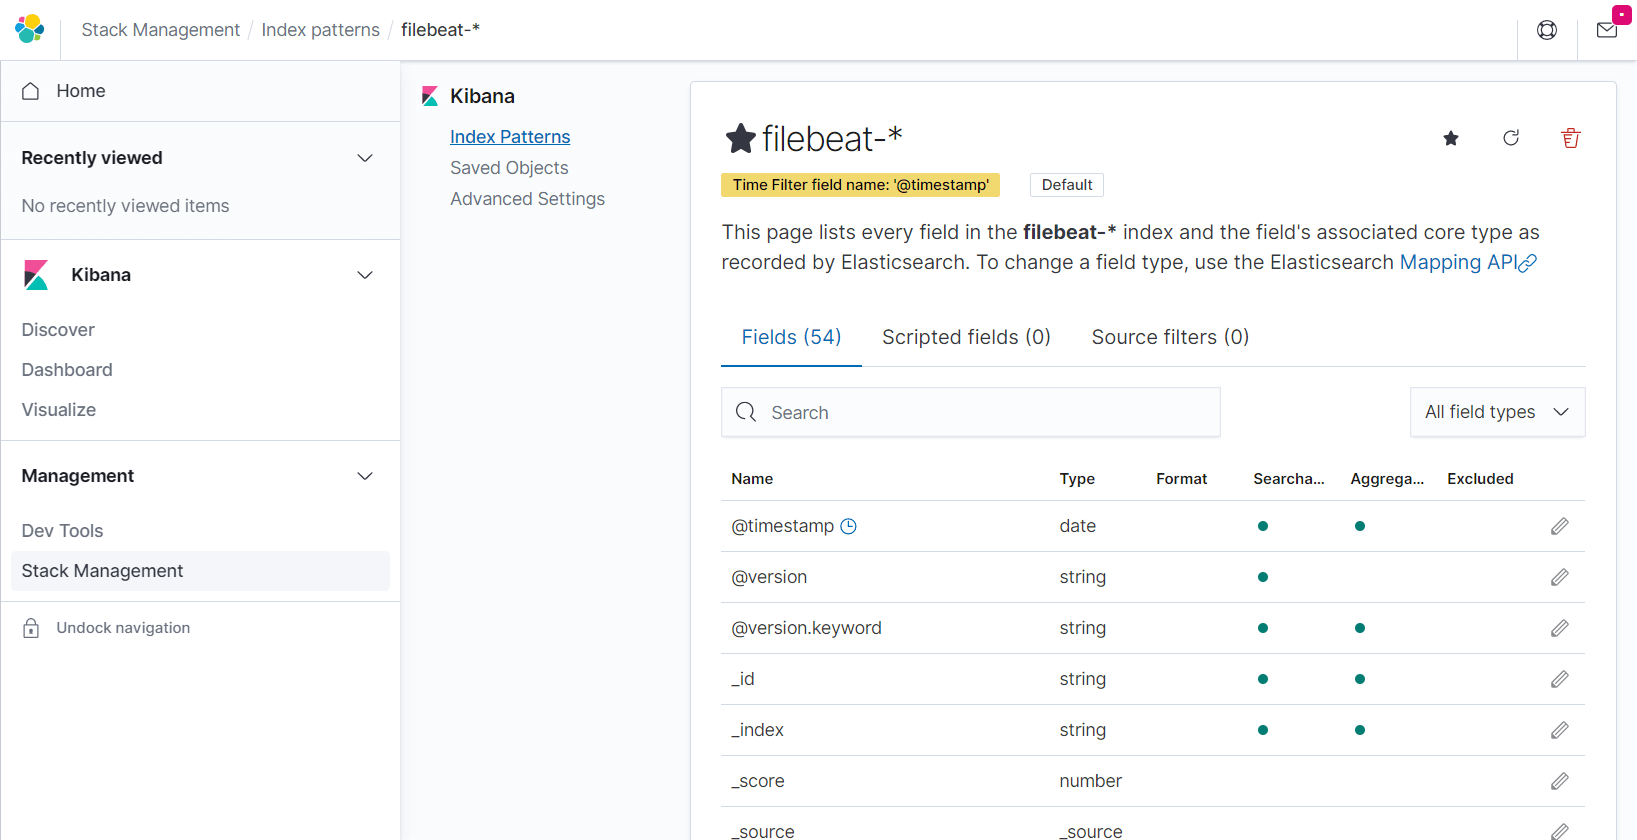
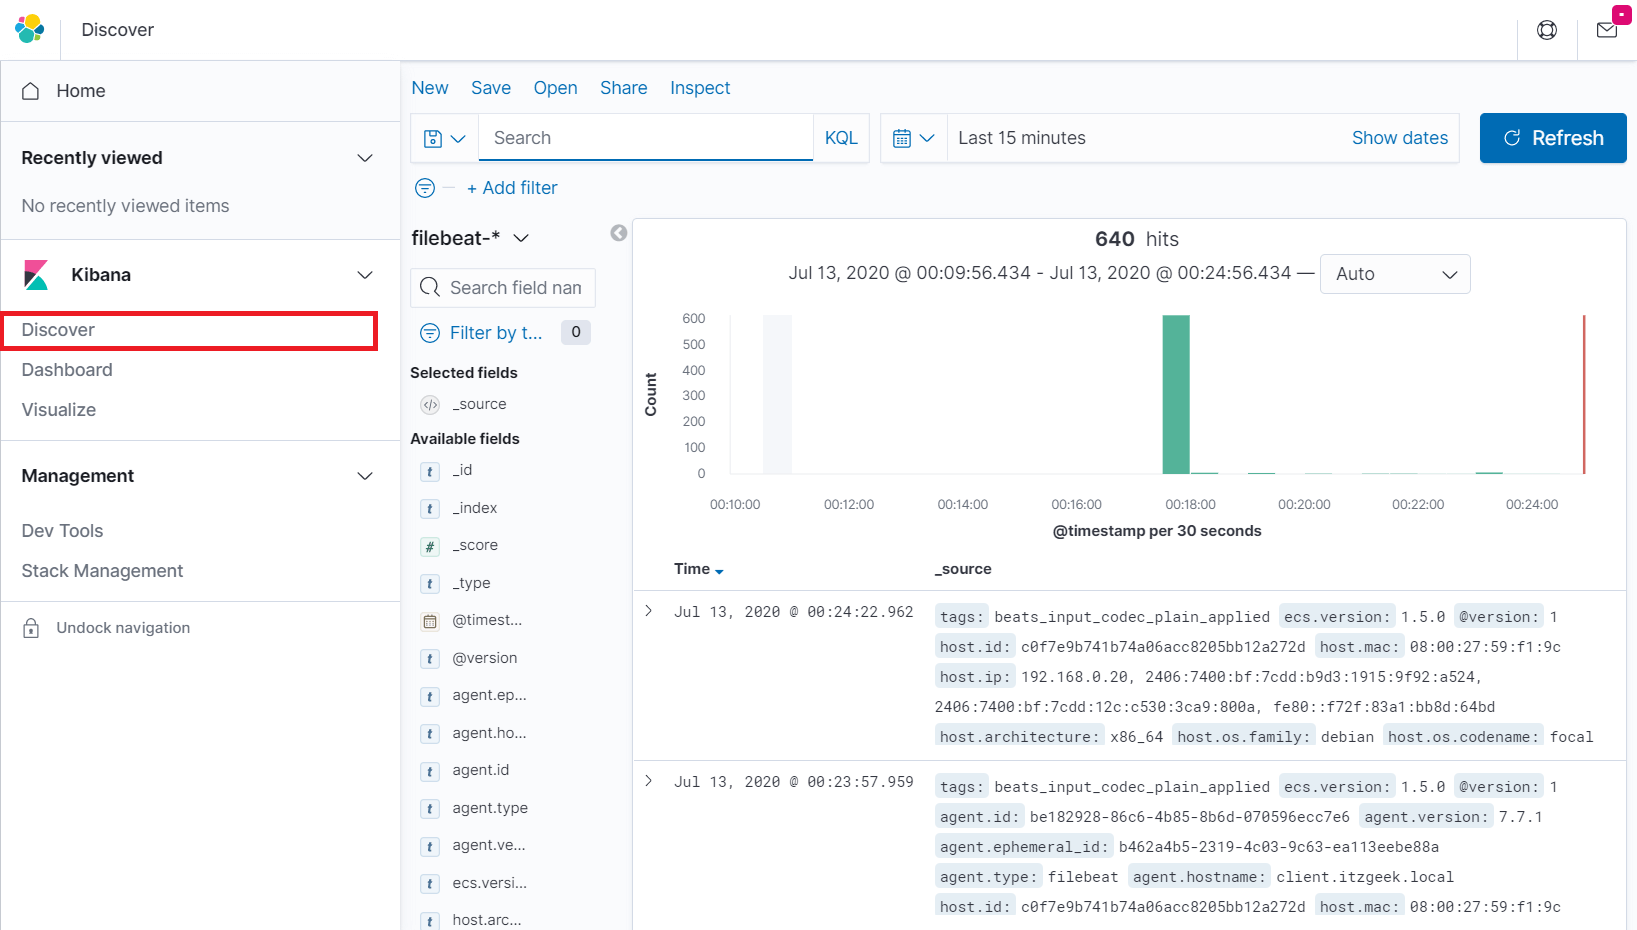
Click Discover in the left navigation to view the incoming logs from a client machine.
Conclusion
That’s All. I hope you have learned how to install ELK stack on Debian 10 / Debian 9. Please share your feedback in the comments section.