ELK stack is abbreviated as Elasticsearch, Logstash, and Kibana stack, an open source full featured analytics stack helps to analyze any machine data. It is used as an alternative to other commercial data analytic software such as Splunk.
I hope you do not require an introduction of ELK stack if you still need it; I have written many tutorials on configuring ELK stack on Linux operating systems.
You can follow below tutorials to understand what ELK is,
In this tutorial, we will see how to run ELK stack on Docker container instead of installing them on host operating system.
We can run the ELK stack either using Docker Native CLI or Docker compose.
Prerequisites:
All you need to have is latest Docker installed on your system. Make sure the docker version is 1.6 and later, but, some images, for ex. elasticsearch is officially supported on only Docker version 1.12.1
- How to install Docker on Ubuntu 16.04 / 15.10 / 14.04
- How to setup Docker on CentOS 7 / RHEL 7
- How to install Docker on Fedora 24 / 23
How to install Docker on openSUSE
The Docker images that we are using here are the official images from the Elastic
Elasticsearch:
To begin, we will run an Elastisearch container. Elasticsearch image is configured with a volume at /usr/share/elasticsearch/data to keep the persisted index data. So use that path if you would like to save the data in a mounted volume which is /esdata.
Create a /esdata directory on Docker host.
mkdir /esdata
Run the following command to create the Elasticsearch Docker container. Host path always comes first in the command line and the :, then container internal volume.
docker run -d --name elasticsearch -p 9200:9200 -p 9300:9300 -v /esdata:/usr/share/elasticsearch/data elasticsearch
Use the CURL to get the response from Elasticsearch.
curl -X GET https://localhost:9200

{
  "name" : "Red Skull",
  "cluster_name" : "elasticsearch",
  "version" : {
    "number" : "2.3.5",
    "build_hash" : "90f439ff60a3c0f497f91663701e64ccd01edbb4",
    "build_timestamp" : "2016-07-27T10:36:52Z",
    "build_snapshot" : false,
    "lucene_version" : "5.5.0"
  },
  "tagline" : "You Know, for Search"
}
Logstash:
Once the Elasticsearch is up and running, we will now ready to run the Logstash container. Before starting the Logstash container, create a configuration file to receive the logs from the beats.
Create the directory and configuration file on the Docker host.
mkdir /logstash
vi /logstash/logstash.conf
Below configuration file is to receive the logs with log type “syslog” on port “5044 “and send them to Elasticsearch for indexing.
input {
 beats {
 port => 5044
 }
 }
filter {
if [type] == "syslog" {
    grok {
      match => { "message" => "%{SYSLOGLINE}" }
    }

    date {
match => [ "timestamp", "MMM  d HH:mm:ss", "MMM dd HH:mm:ss" ]
}
  }

}
output {
 elasticsearch {
  hosts => ["elasticsearch:9200"]
    index => "%{[@metadata][beat]}-%{+YYYY.MM.dd}"
       }
stdout {
    codec => rubydebug
       }
}
In the above configuration file, if you see the output section; elasticsearch host is defined as elasticsearch:9200. You might think that how the Logstash will resolve that host to send logs, do not worry; Docker linking (–link) will take care of that.
cd /logstash/
Create a Logstash container by issuing the following command.
Where,
–link elasticsearch-container-name:hostname-in-config-file
docker run -d --name logstash -p 5044:5044 --link elasticsearch:elasticsearch -v "$PWD":/logstash logstash -f /logstash/logstash.conf
Kibana:
Kibana container does not require any configuration, all you have to do is just link the Kibana Docker container with Elasticsearch container.
docker run --name kibana --link elasticsearch:elasticsearch -p 5601:5601 -d kibana
Verify:
User docker ps command to check whether all the containers are running or not.
docker ps

CONTAINER ID        IMAGE               COMMAND                  CREATED             STATUS              PORTS                                            NAMES
824dc7ee3c9f        kibana              "/docker-entrypoint.s"   About an hour ago   Up About an hour    0.0.0.0:5601->5601/tcp                           kibana
4fa8a72c96a2        logstash            "/docker-entrypoint.s"   About an hour ago   Up About an hour    0.0.0.0:5044->5044/tcp                           logstash
4ea93b1d838b        elasticsearch       "/docker-entrypoint.s"   About an hour ago   Up About an hour    0.0.0.0:9200->9200/tcp, 0.0.0.0:9300->9300/tcp   elasticsearch
Installing and Configuring Beats:
Beats are the one collects and send logs to Logstash. Installation and configuration of beats are out of scope.
- How to install and configure Filebeat on Ubuntu / Debian
- How to install and configure Filebeat on CentOS 7 / RHEL 7
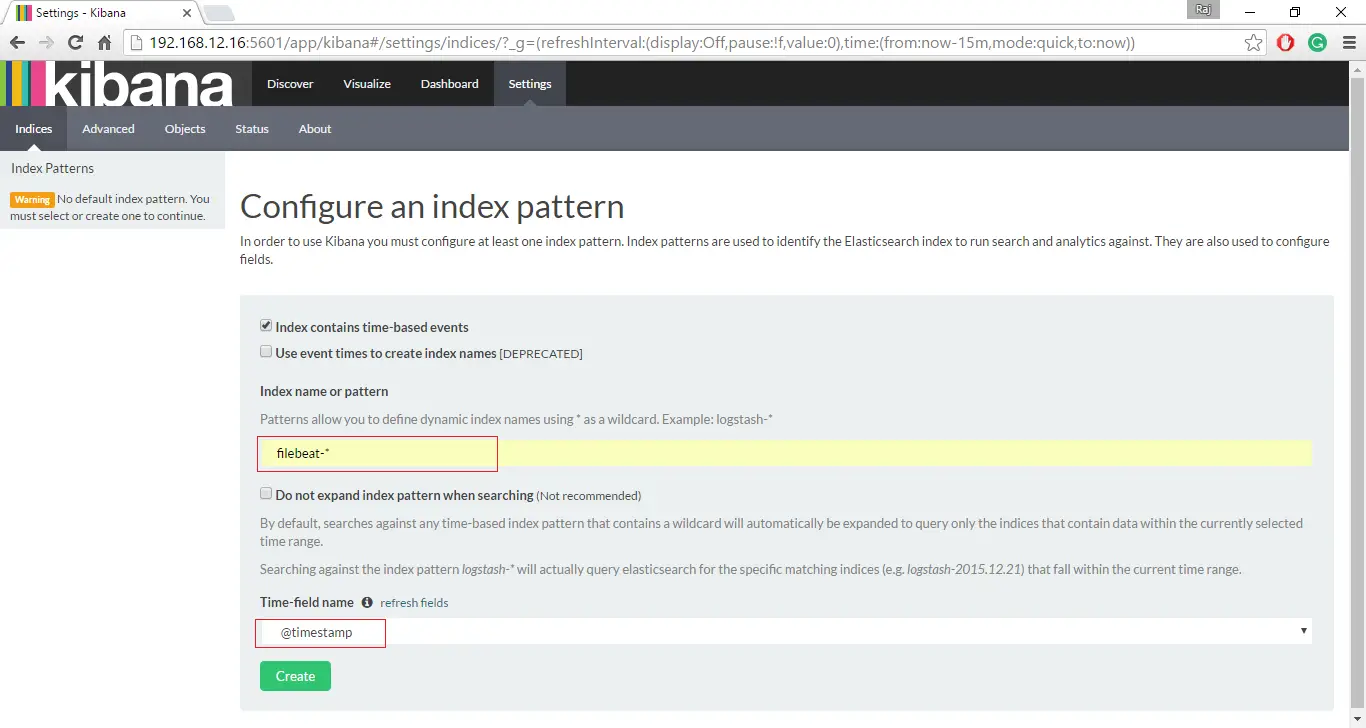
Access the Kibana Interface:
If all the containers are up and running as expected, visit the following URL to access the web interface.
Set up a beat index to begin the searching of data using Kibana.
Click on Discover to start searching the latest logs from the filebeat.
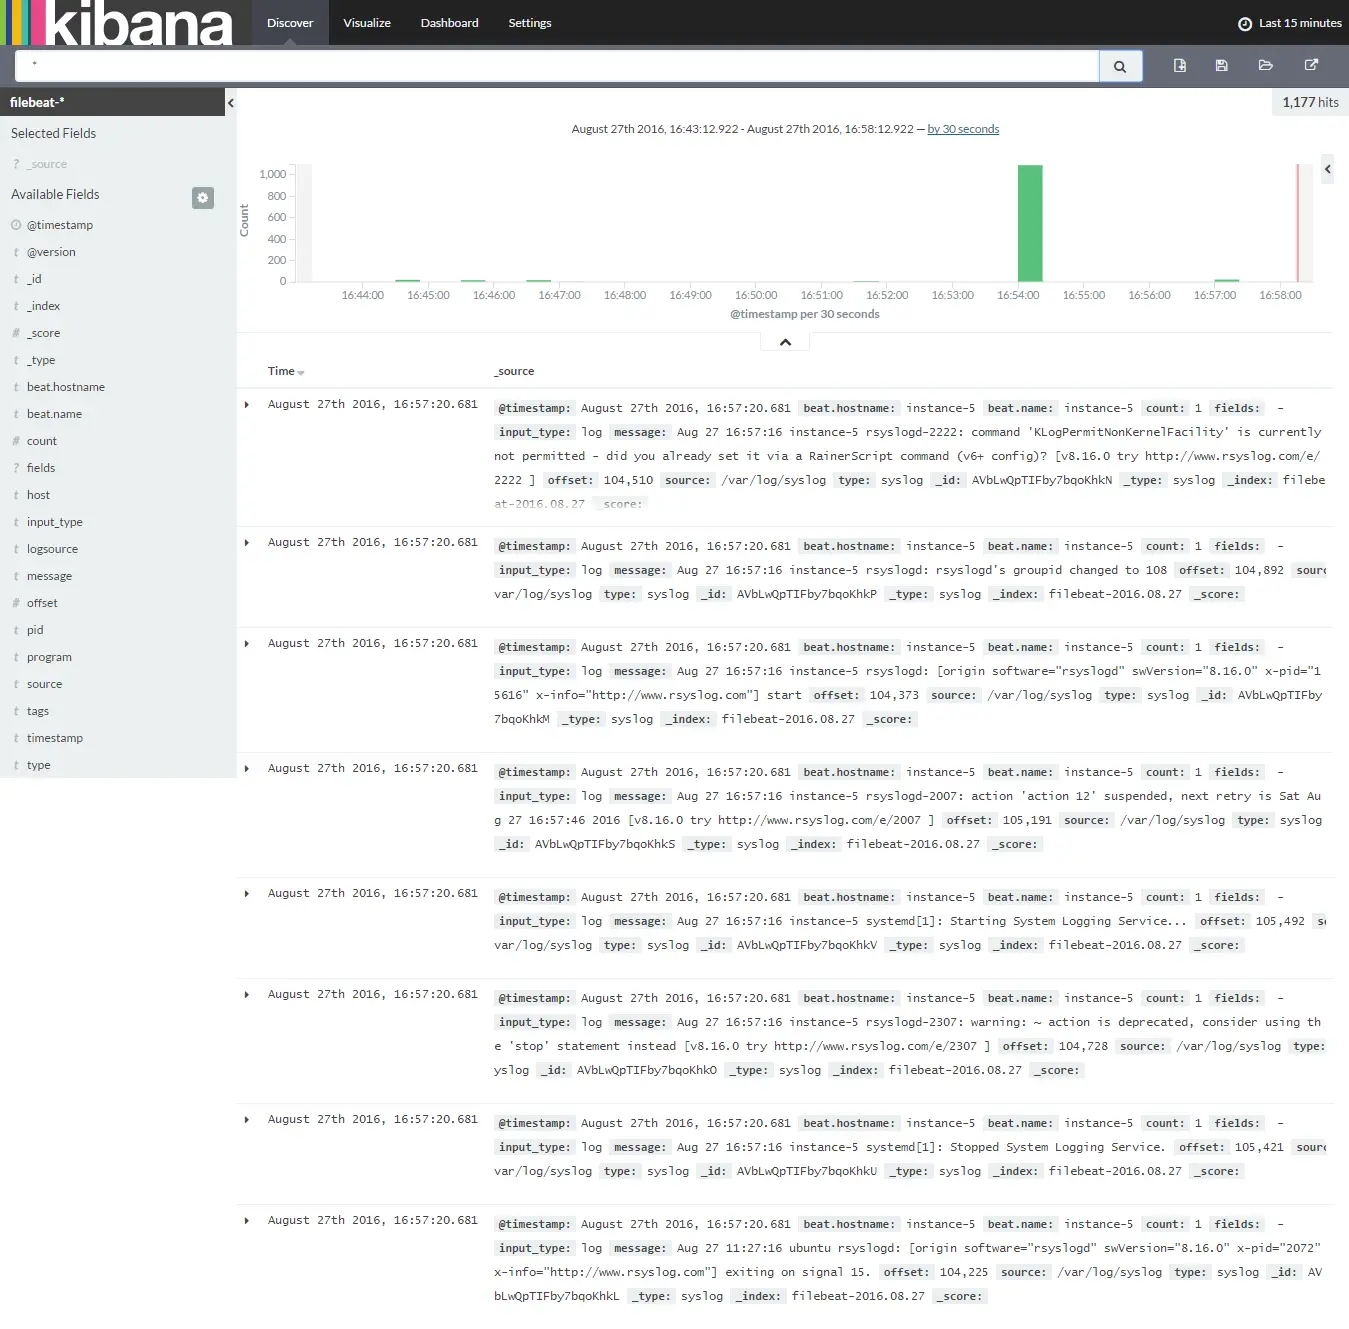
That’s All, for now.