
In this post, will look how to install Elasticsearch, Logstash and Kibana 4 on CentOS 7 / RHEL 7. This ELK stack help us to store and manage the logs in a centralized location. ELK stack consists of four vital components that makes a wonderful stack to analyze the problems by correlating the events on a particular time.
Centralizing logs will make a system admin life easier to analyze the problems and issues without going to each machine for logs, and visualize those logs to management for business requirements.
Components:
Logstash – It does the processing (Collect, parse and send it to Elasticsearch) of incoming logs.
Elasticsearch – Stores the logs coming from Logstash.
Kibana 4 – Web interface for visualizing the logs (has an own interface).
The above three are installed on server.
Logstash-forwarder – Installed on client machines, sends log to Logstash through lumberjack protocol.
Application versions:
This article uses below version of softwares for ELK stack.
Elastisearch 1.5.0
logstash-1.4.2
Kibana 4
logstash-forwarder-0.4.0
Prerequisites:
1. We would require to install either openJDK or Oracle JDK, It is recommended to install Oracle JDK. Verify the java version by using the following command.
# java -version

java version "1.8.0_11"
Java(TM) SE Runtime Environment (build 1.8.0_11-b12)
Java HotSpot(TM) 64-Bit Server VM (build 25.11-b03, mixed mode)
2. Configure EPEL repository on CentOS 7 / RHEL 7.
3. Install wget.
# yum -y install wget
Install Elasticsearch:
Elasticsearch is an open source search server, it offers a realtime distributed search and analytics with RESTful web interface. Elasticsearch stores all the logs sent by the logstash server and displays the messages when the kibana4 requests for full filling user request over the web interface. This topic covers configuration settings that is required for ELK, you can also take a look on Install Elasticsearch on CentOS 7 / Ubuntu 14.10 / Linux Mint 17.1 for detailed instruction.
Let’s install the Elasticsearch, it can be downloaded from official website. You can use the following command to download via terminal and install it.
# wget https://download.elasticsearch.org/elasticsearch/elasticsearch/elasticsearch-1.5.0.noarch.rpm

# rpm -Uvh elasticsearch-1.5.0.noarch.rpm
Configure Elasticsearch to start during system startup.
# systemctl daemon-reload
# systemctl enable elasticsearch.service
# systemctl start elasticsearch.service
Wait, at least a minute to let the Elasticsearch get fully restarted, otherwise testing will fail. Elastisearch should be now listen on 9200 for processing HTTP request, we can use CURL to get the response.
# curl -X GET https://localhost:9200
{
"status" : 200,
"name" : "Delphi",
"cluster_name" : "elasticsearch",
"version" : {
"number" : "1.5.0",
"build_hash" : "544816042d40151d3ce4ba4f95399d7860dc2e92",
"build_timestamp" : "2015-03-23T14:30:58Z",
"build_snapshot" : false,
"lucene_version" : "4.10.4"
},
"tagline" : "You Know, for Search"
}
Install Logstash:
Logstash is an open source tool, used for collecting logs, parsing and storing them searching. Yes, logstash comes with a web interface (kibana3 is built-in) for visualizing logs which we are not going to discuss here instead we use kibana4. Processing of various types of events can be extended by adding plugins to it, over 160 plugins are available as of now. Lets will go directly to the installation.
# wget https://download.elasticsearch.org/logstash/logstash/packages/centos/logstash-1.4.2-1_2c0f5a1.noarch.rpm

# rpm -Uvh logstash-1.4.2-1_2c0f5a1.noarch.rpm
Once the logstash server is installed, lets move on to next section
Create SSL certificate:
Logstash-forwarder which will be installed on client-server to ship the logs requires SSL certificate to validate identity of logstash server. We have a two options to create a SSL certificate and it depends on logstash-forwarder configuration; if the hostname ( “servers”: [ “itzgeek:5050” ]) is used, subject name of SSL should match “itzgeek”. If you use ( “servers”: [ “10.0.0.26:5050” ]) an ip address, you must create a SSL certificate with IP SAN with value 10.0.0.26.
Follow any one of the method to create a SSL certificate.
Option 1: (Hostname FQDN)
Before creating a certificate, make sure you have A record for logstash server; ensure that client servers are able to resolve the hostname of the logstash server. If you do not have DNS, kindly add the host entry for logstash server; where 10.0.0.26 is the ip address of logstash server and itzgeek is the hostname of your logstash server.
# vi /etc/hosts

10.0.0.26 itzgeek
Lets create a SSl certificate.
Goto OpenSSL directory.
# cd /etc/pki/tls
Execute the following command to create a SSL certificate, replace “red” one in with your real logstash server.
# openssl req -x509 -nodes -newkey rsa:2048 -days 365 -keyout private/logstash-forwarder.key -out certs/logstash-forwarder.crt -subj /CN=itzgeek
Option 2: (IP Address)
Before creating a SSL certificate, we would require to an add ip address of logstash server to SubjectAltName in the OpenSSL config file.
# vi /etc/pki/tls/openssl.cnf
Goto “[ v3_ca ]” section and replace “red” one with your logstash server ip.
subjectAltName = IP:10.0.0.26
Goto OpenSSL directory.
# cd /etc/pki/tls
Execute the following command to create a SSL certificate.
# openssl req -x509 -days 365 -batch -nodes -newkey rsa:2048 -keyout private/logstash-forwarder.key -out certs/logstash-forwarder.crt
This logstash-forwarder.crt should be copied to all client servers those who send logs to logstash server.
Configure Logstash:
Logstash configuration files can be found in /etc/logstash/conf.d/, just an empty folder. We would need to create file, logstash configuration files consist of three section input, filter and output; all three section can be found either in single file or each section will have separate files ends with .conf.
Here we will use a single file to place an input, filter and output sections.
# vi /etc/logstash/conf.d/logstash_syslogs.conf
In the first section, we will put an entry for input configuration. The following configuration sets lumberjack to listen on port 5050 for incoming logs from the logstash-forwarder that sits in client servers, also it will use the SSL certificate that we created earlier.
input {
lumberjack {
port => 5050
type => "logs"
ssl_certificate => "/etc/pki/tls/certs/logstash-forwarder.crt"
ssl_key => "/etc/pki/tls/private/logstash-forwarder.key"
}
}
In the second section, we will put an entry for filter configuration. Grok is a filter in logstash, which does parsing of logs before sending it to Elasticsearch for storing. The following grok filter will look for the logs that are labeled as ‘syslog” and tries to parse them to make a structured index.
filter {
if [type] == "syslog" {
    grok {
      match => { "message" => "%{SYSLOGLINE}" }
    }

    date {
match => [ "timestamp", "MMM  d HH:mm:ss", "MMM dd HH:mm:ss" ]
}
  }

}
Consider visiting grokdebugger for filter patterns.
In the third section, we will put an entry of output configuration. This section defines location where the logs get stored; obviously it should be Elasticsearch.
output {
elasticsearch { host => localhost index => "logstash-%{+YYYY.MM.dd}" }
stdout { codec => rubydebug }
}
Now start the logstash service.
# systemctl start logstash.service
Logstash server logs are stored in the following file, will help us to troubleshoot the issues.
# cat /var/log/logstash/logstash.log
Next we will configure a logstash-forwarder to ship logs to logstash server.
Configure Logstash-forwarder.
Logstash-forwarder is a client software which ship logs to a logstash server, it should be installed on all client servers. Logstash-forwarder can be downloaded from official website or you can use the following command to download it in terminal and install it.
# wget https://download.elasticsearch.org/logstash-forwarder/binaries/logstash-forwarder-0.4.0-1.x86_64.rpm

# rpm -Uvh logstash-forwarder-0.4.0-1.x86_64.rpm
Logstash-forwader uses SSL certificate for validating logstash server identity, so copy the logstash-forwarder.crt that we created earlier from the logstash server to the client. Open up the configuration file.
# vi /etc/logstash-forwarder.conf
In the “network” section, mention the logstash server with port number and path to the logstash-forwarder certificate that you copied from logstash server. This section defines the logstash-forwarder to send a logs to logstash server “itzgeek” on port 5050 and client validates the server identity with the help of SSL certificate.
Note: Replace “itzgeek” with ip address incase if you are using IP SAN.
"servers": [ "itzgeek:5050" ],

"ssl ca": "/etc/pki/tls/certs/logstash-forwarder.crt",

"timeout": 15
In the “files” section, configures what all are files to be shipped. In this article we will configure a logstash-forwarder to send a logs (/var/log/messages) to logstash server with “syslog” as type.
{
"paths": [
"/var/log/messages"
],

"fields": { "type": "syslog" }
}
Restart the service.
# systemctl start logstash-forwarder.service
You can look at a log file in case of any issue.
# cat /var/log/logstash-forwarder/logstash-forwarder.err
Configure Kibana 4:
Kidbana provides visualization of logs, download it from official website. Use the following command to download it in terminal.
wget https://download.elasticsearch.org/kibana/kibana/kibana-4.0.2-linux-x64.tar.gz
Extract and move it to /opt/
tar -zxvf kibana-4.0.2-linux-x64.tar.gz

mv kibana-4.0.2-linux-x64 /opt/kibana4
Enable PID file for Kibana, this is required to create a systemd init file.
# sed -i 's/#pid_file/pid_file/g' /opt/kibana4/config/kibana.yml
Kibana can be started by running /opt/kibana4/bin/kibana, to run kibana as a server we will create a systemd file.
# vi /etc/systemd/system/kibana4.service

[Unit]
Description=Kibana 4 Web Interface
After=elasticsearch.service
After=logstash.service
[Service]
ExecStartPre=rm -rf /var/run/kibana.pid
ExecStart=/opt/kibana4/bin/kibana/
ExecReload=kill -9 $(cat /var/run/kibana.pid) && rm -rf /var/run/kibana.pid && /opt/kibana4/bin/kibana/
ExecStop=kill -9 $(cat /var/run/kibana.pid)
[Install]
WantedBy=multi-user.target
Start and enable kibana to start automatically at system startup.
# systemctl start kibana4.service

systemctl enable kibana4.service
Access your kibana portal by visiting the following link
https://your-ip-address:5601/
You will get a following page where you have to map logstash index to use kibana. Scroll down on Time-field name and select
@timestamp
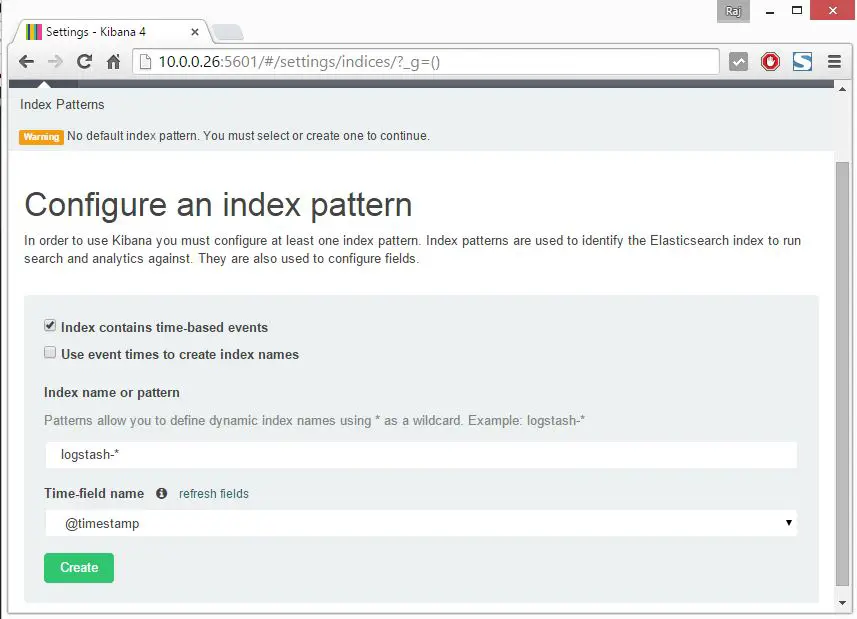
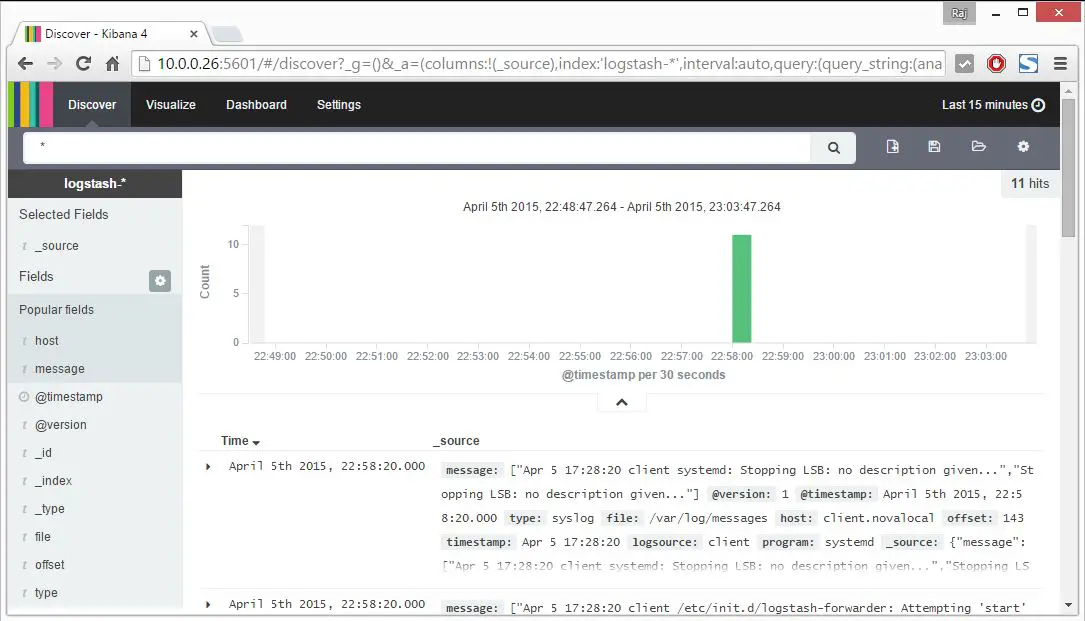
Once you selected, it will redirect you to kibana main page.
Kibana does not comes with any kind of password protected access to portal. With Nginx, we can configure in such a way that the user should fulfill authentication mechanism before entering to portal.
That’s All, you have successfully configured ELK stack for centralized log management.