ELK stack is also known as the Elastic stack, consists of Elasticsearch, Logstash, and Kibana. It helps you to have all of your logs stored in one place and analyze the issues by correlating the events at a particular time.
This guide helps you to install ELK stack on CentOS 7 / RHEL 7.
Components
Logstash – It does the processing (Collect, enrich and send it to Elasticsearch) of incoming logs sent by beats (forwarder).
Elasticsearch – It stores incoming logs from Logstash and provides an ability to search the logs/data in a real-time
Kibana – Provides visualization of logs.
Beats – Installed on client machines, send logs to Logstash through beats protocol.
Environment
To have a full-featured ELK stack, we would need two machines to test the collection of logs.
ELK Stack
Operating system : CentOS 7 Minimal
IP Address       : 192.168.1.10
HostName         : server.itzgeek.local
Filebeat
Operating System : CentOS 7 Minimal
IP Address       : 192.168.1.20
HostName         : client.itzgeek.local
Prerequisites
Install Java
Since Elasticsearch is based on Java, make sure you have either OpenJDK or Oracle JDK is installed on your machine.
READ: How to Install Oracle Java 8 on CentOS 7 / RHEL 7
Here, I am using OpenJDK 1.8.
yum -y install java-1.8.0 wget
Verify the Java version.
java -version
Output:
java version "1.8.0_181"
Java(TM) SE Runtime Environment (build 1.8.0_181-b13)
Java HotSpot(TM) 64-Bit Server VM (build 25.181-b13, mixed mode)
Configure ELK repository
Import the Elastic signing key.
rpm --import https://artifacts.elastic.co/GPG-KEY-elasticsearch
Setup the Elasticsearch repository and install it.
vi /etc/yum.repos.d/elk.repo
Add the below content to the elk.repo file.
[elasticsearch-6.x]
name=Elasticsearch repository for 6.x packages
baseurl=https://artifacts.elastic.co/packages/6.x/yum
gpgcheck=1
gpgkey=https://artifacts.elastic.co/GPG-KEY-elasticsearch
enabled=1
autorefresh=1
type=rpm-md
Install Elasticsearch
Elasticsearch is an open source search engine, offers a real-time distributed search and analytics with the RESTful web interface. Elasticsearch stores all the data are sent by the Logstash and displays through the web interface (Kibana) on users request.
Install Elasticsearch.
yum install -y elasticsearch
Configure Elasticsearch to start during system startup.
systemctl daemon-reload
systemctl enable elasticsearch
systemctl start elasticsearch
Use CURL to check whether the Elasticsearch is responding to the queries or not.
curl -X GET http://localhost:9200
Output:
 {
  "name" : "1DwGO86",
  "cluster_name" : "elasticsearch",
  "cluster_uuid" : "xboS_6K5Q2OO1XA-QJ9GIQ",
  "version" : {
    "number" : "6.4.0",
    "build_flavor" : "default",
    "build_type" : "rpm",
    "build_hash" : "595516e",
    "build_date" : "2018-08-17T23:18:47.308994Z",
    "build_snapshot" : false,
    "lucene_version" : "7.4.0",
    "minimum_wire_compatibility_version" : "5.6.0",
    "minimum_index_compatibility_version" : "5.0.0"
  },
  "tagline" : "You Know, for Search"
}
Install Logstash
Logstash is an open source tool for managing events and logs, it collects the logs, parse them and store them on Elasticsearch for searching. Over 160+ plugins are available for Logstash which provides the capability of processing the different type of events with no extra work.
Install the Logstash package.
yum -y install logstash
Create SSL certificate (Optional)
Filebeat (Logstash Forwarder) are normally installed on client servers, and they use SSL certificate to validate the identity of Logstash server for secure communication.
Create SSL certificate either with the hostname or IP SAN.
Option 1: (Hostname FQDN)
If you use the Logstash server hostname in the beats (forwarder) configuration, make sure you have A record for Logstash server and also ensure that client machine can resolve the hostname of the Logstash server.
Go to the OpenSSL directory.
cd /etc/pki/tls/
Now, create the SSL certificate. Replace green one with the hostname of your real Logstash server.
openssl req -x509 -nodes -newkey rsa:2048 -days 365 -keyout private/logstash-forwarder.key -out certs/logstash-forwarder.crt -subj /CN=server.itzgeek.local
Option 2: (IP Address)
If you are planning to use an IP address instead of hostname, please follow the steps to create an SSL certificate for IP SAN.
To create an IP SAN certificate, you would need to add an IP address of Logstash server to the SubjectAltName in the OpenSSL config file.
vi /etc/pki/tls/openssl.cnf
Look for “[ v3_ca ]” section and replace green one with the IP of your Logstash server.
subjectAltName = IP:192.168.1.10
Goto OpenSSL directory.
cd /etc/pki/tls/
Now, create an SSL certificate by running following command.
openssl req -x509 -days 365 -batch -nodes -newkey rsa:2048 -keyout private/logstash-forwarder.key -out certs/logstash-forwarder.crt
Configure Logstash
Logstash configuration can be found in /etc/logstash/conf.d/. Logstash configuration file consists of three sections input, filter, and the output. All three sections can be found either in a single file or separate files end with .conf.
I recommend you to use a single file for placing input, filter and output sections.
vi /etc/logstash/conf.d/logstash.conf
In the first section, we will put an entry for input configuration. The following configuration sets Logstash to listen on port 5044 for incoming logs from the beats (forwarder) that sit on client machines.
Also, add the SSL certificate details in the input section for secure communication – Optional.
input {
 beats {
   port => 5044

   # Set to False if you do not use SSL
   ssl => true

   # Delete below linesif you do not use SSL
   ssl_certificate => "/etc/pki/tls/certs/logstash-forwarder.crt"
   ssl_key => "/etc/pki/tls/private/logstash-forwarder.key"
   }
}
In the filter section. We will use Grok to parse the logs ahead of sending it to Elasticsearch. The following grok filter will look for the syslog labeled logs and tries to parse them to make a structured index.
filter {
if [type] == "syslog" {
    grok {
      match => { "message" => "%{SYSLOGLINE}" }
    }

    date {
match => [ "timestamp", "MMM  d HH:mm:ss", "MMM dd HH:mm:ss" ]
}
  }

}
For more filter patterns, take a look at grokdebugger page.
In the output section, we will define the location where the logs to get stored; obviously, it should be Elasticsearch.
output {
 elasticsearch {
  hosts => localhost
    index => "%{[@metadata][beat]}-%{+YYYY.MM.dd}"
       }
stdout {
    codec => rubydebug
       }
}
Now start and enable the Logstash service.
systemctl start logstash
systemctl enable logstash
You can troubleshoot any issues by looking at Logstash logs.
cat /var/log/logstash/logstash-plain.log
Install & Configure Kibana
Kibana provides visualization of logs stored on the Elasticsearch. Install the Kibana using the following command.
yum -y install kibana
Edit the kibana.yml file.
vi /etc/kibana/kibana.yml
By default, Kibana listens on localhost which means you can not access Kibana interface from external machines. To allow it, edit the below line with your machine IP.
server.host: "192.168.1.10"
Uncomment the following line and update it with the Elasticsearch instance URL. In my case, it is localhost.
elasticsearch.url: "http://localhost:9200"
Start and enable kibana on system startup.
systemctl start kibana
systemctl enable kibana
Firewall
Configure a firewall on the ELK stack node to receive the logs from client machines.
5044 – For Logstash to receive the logs
5061 – To access the Kibana Interface from the external machine.
firewall-cmd --permanent --add-port=5044/tcp
firewall-cmd --permanent --add-port=5601/tcp
firewall-cmd --reload
Next, we will configure beats to ship the logs to Logstash server.
Install and Configure Filebeat
There are four beats clients available
- Packetbeat – Analyze network packet data.
- Filebeat – Real-time insight into log data.
- Topbeat – Get insights from infrastructure data.
- Metricbeat – Ship metrics to Elasticsearch.
To analyze the system logs of the client machine (Ex. client.itzgeek.local), we need to install filebeat. Create beats.repo file.
vi /etc/yum.repos.d/beats.repo
Add the below content to the above repo file.
[elasticsearch-6.x]
name=Elasticsearch repository for 6.x packages
baseurl=https://artifacts.elastic.co/packages/6.x/yum
gpgcheck=1
gpgkey=https://artifacts.elastic.co/GPG-KEY-elasticsearch
enabled=1
autorefresh=1
type=rpm-md
Now, install Filebeat using the following command.
yum -y install filebeat
Set up a host entry on the client machine in case your environment does not have DNS server.
vi /etc/hosts
Make an host entry like below on the client machine.
192.168.1.10 server.itzgeek.local server
Filebeat (beats) uses SSL certificate for validating Logstash server identity, so copy the logstash-forwarder.crt from the Logstash server to the client.
Skip this step, in case you are not using SSL in Logstash.
scp -pr [email protected]:/etc/pki/tls/certs/logstash-forwarder.crt /etc/ssl/certs/
Filebeat configuration file is in YAML format, which means indentation is very important. Make sure you use the same number of spaces used in the guide.
Open up the filebeat configuration file.
vi /etc/filebeat/filebeat.yml
On top, you would see the prospectors section. Here, you need to specify which logs should be sent to Logstash and how they should be handled. Each prospector starts with – character.
For testing purpose, we will configure filebeat to send /var/log/messages to Logstash server. To do that, modify the existing prospector under paths section.
Comment out the – /var/log/*.log to avoid sending all .log files present in that directory to Logstash.
filebeat.inputs:
- type: log

      # Change to true to enable this input configuration.
      enabled: true

      # Paths that should be crawled and fetched.
      paths:

        - /var/log/messages
        # - /var/log/*.log

.  .  .
Comment out the section output.elasticsearch: as we are not going to store logs directly to Elasticsearch.
Now, find the line output.logstash and modify the entries like below. This section defines filebeat to send logs to Logstash server server.itzgeek.local on port 5044 and mention the path where the copied SSL certificate is placed
Replace server.itzgeek.local with IP address in case if you are using IP SAN.
.   .   .

output.logstash:
  # The Logstash Server
  hosts: ["server.itzgeek.local:5044"]


  # Comment out this line if Logstash is not using SSL
  ssl.certificate_authorities: ["/etc/ssl/certs/logstash-forwarder.crt"]

.   .   .
Restart the service.
systemctl restart filebeat
Beats logs are typically found syslog file.
cat /var/log/filebeat/filebeat
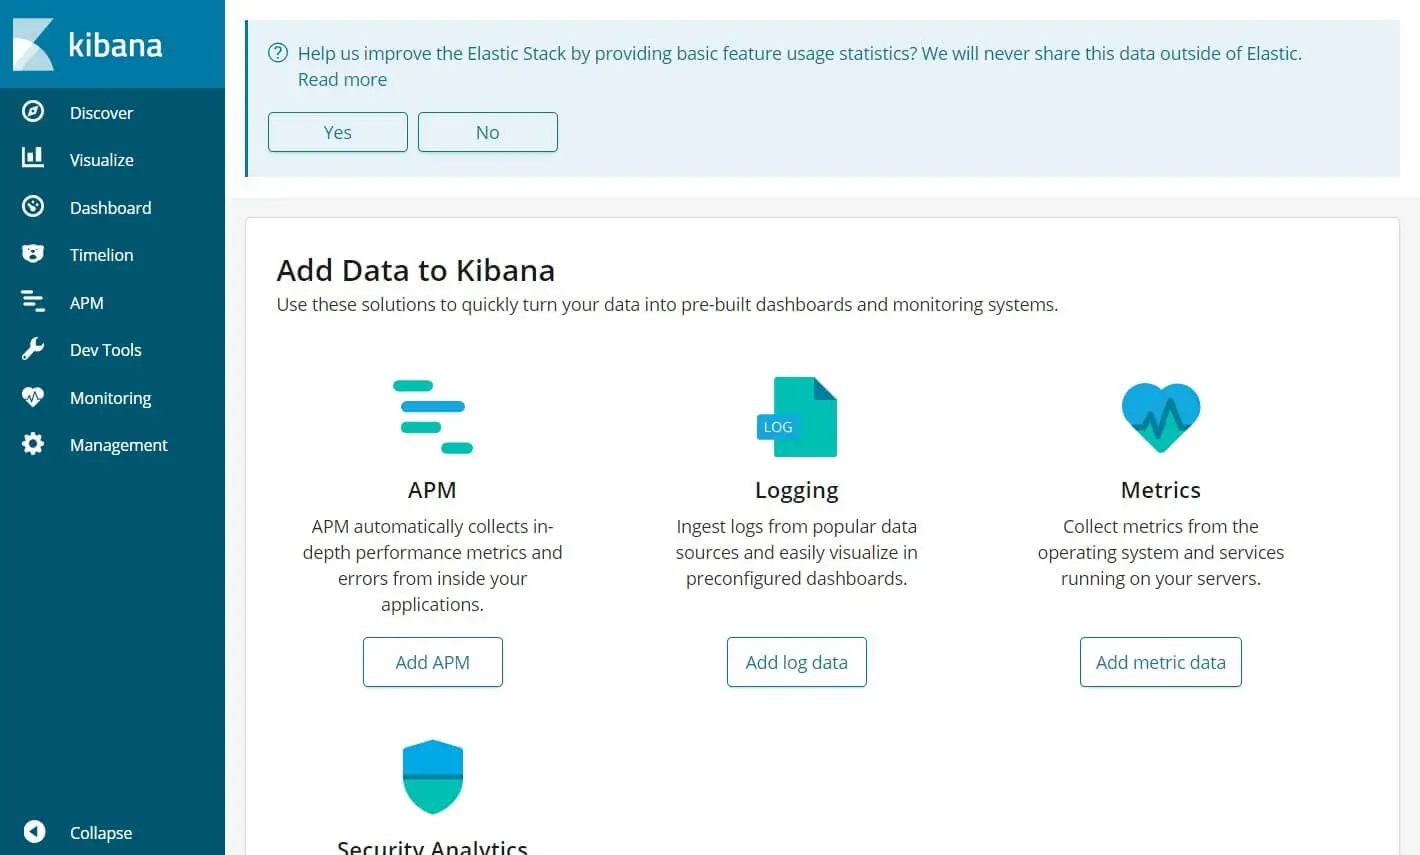
Access Kibana
Access the Kibana using the following URL.
You would get the Kibana’s home page.
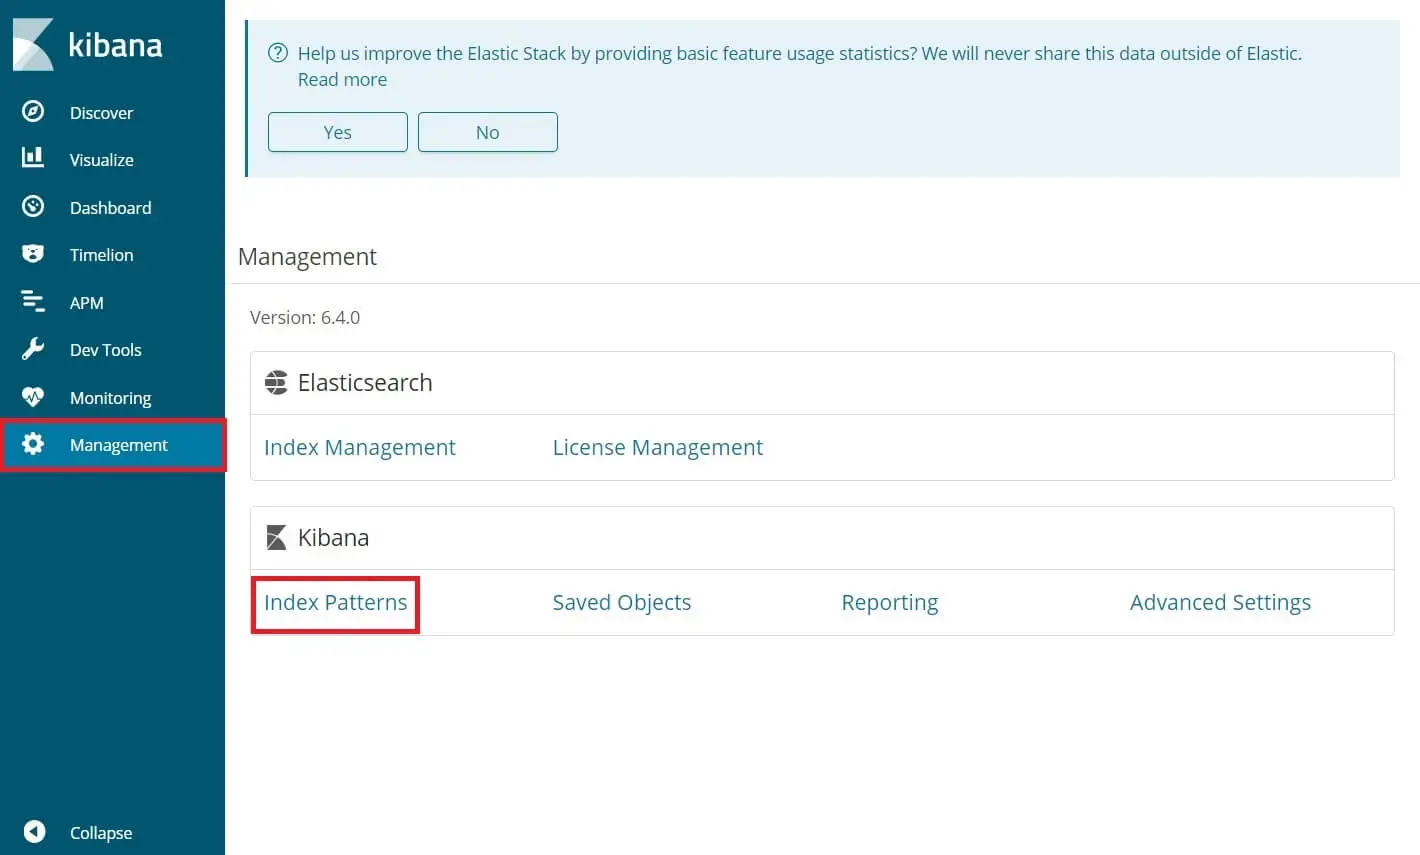
On your first login, you have to map the filebeat index. Go to Management >> Index Patterns.
Type the following in the Index pattern box.
filebeat-*
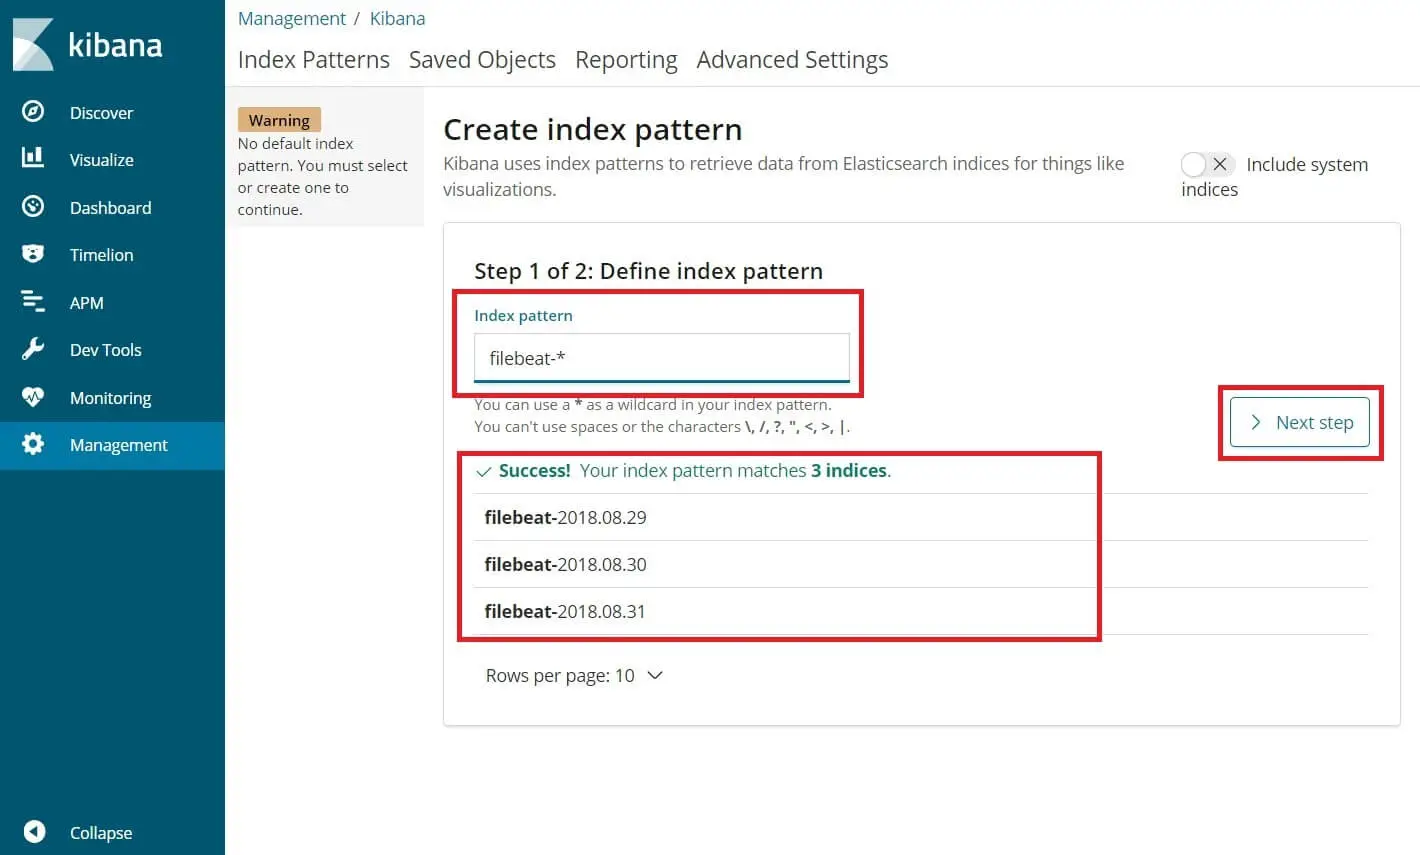
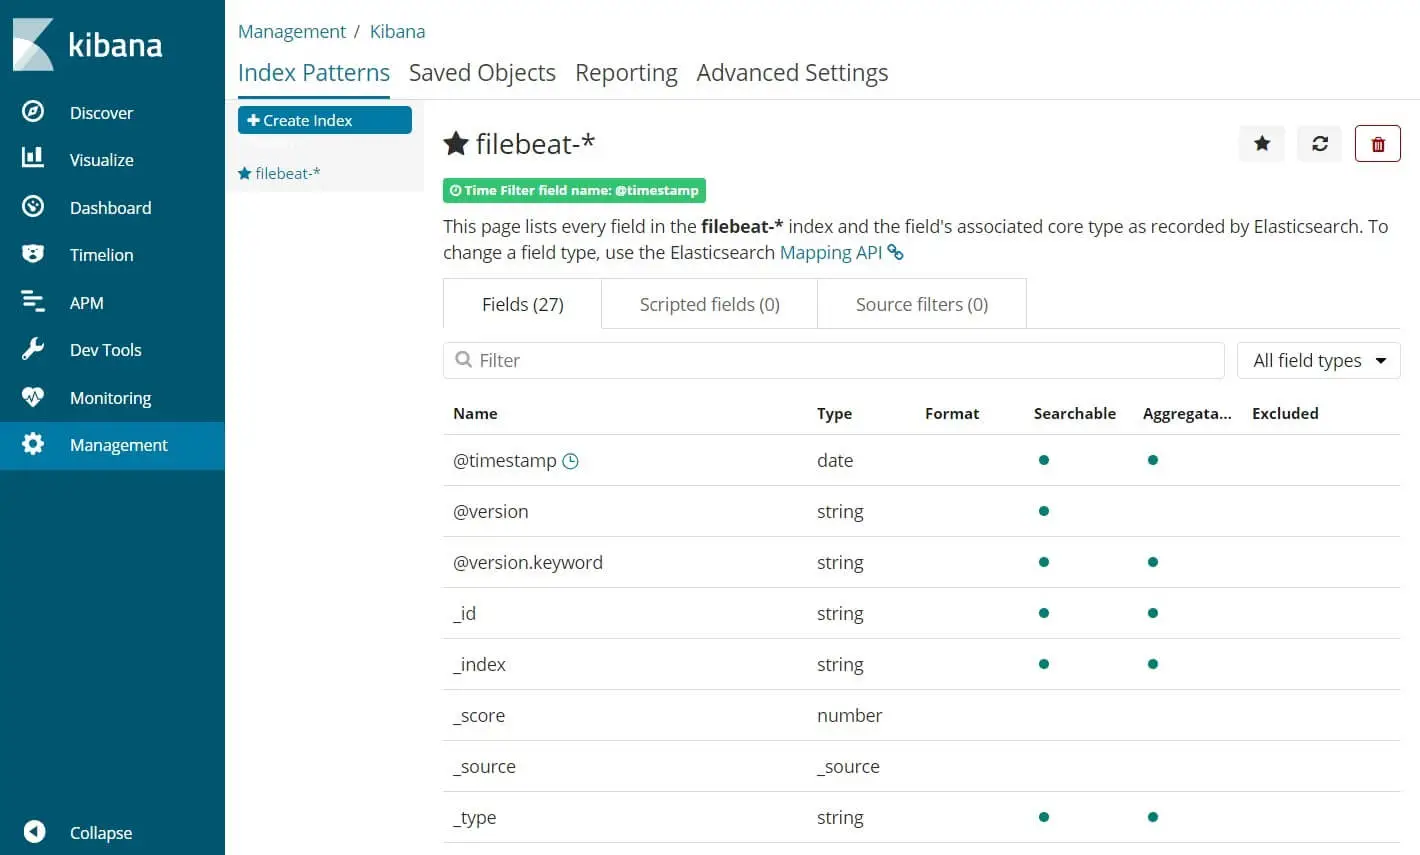
You should see at least one filebeat index something like above. Click Next step.
Select @timestamp and then click on Create.
@timestamp
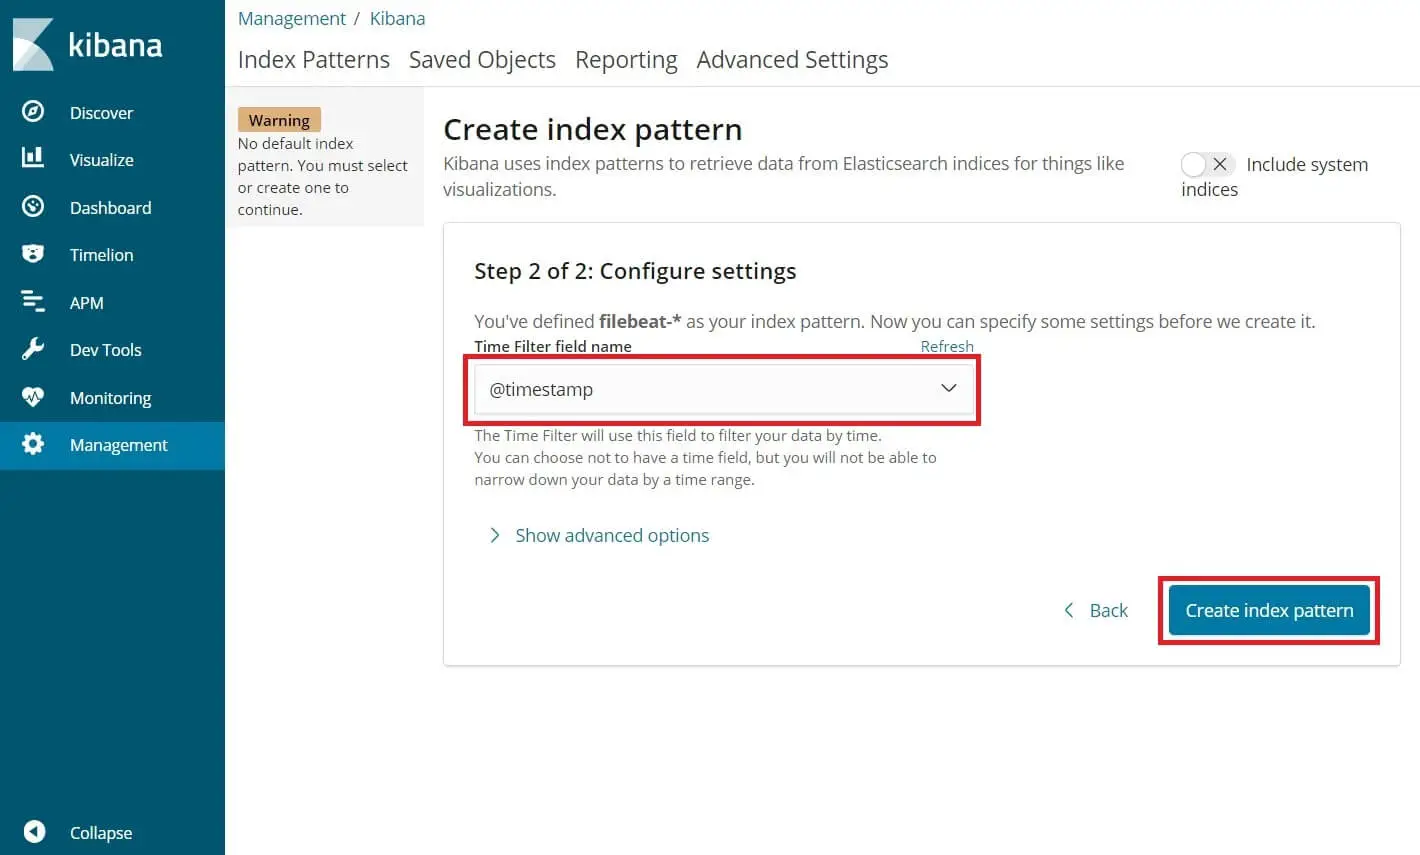
Verify your index patterns and its mappings.
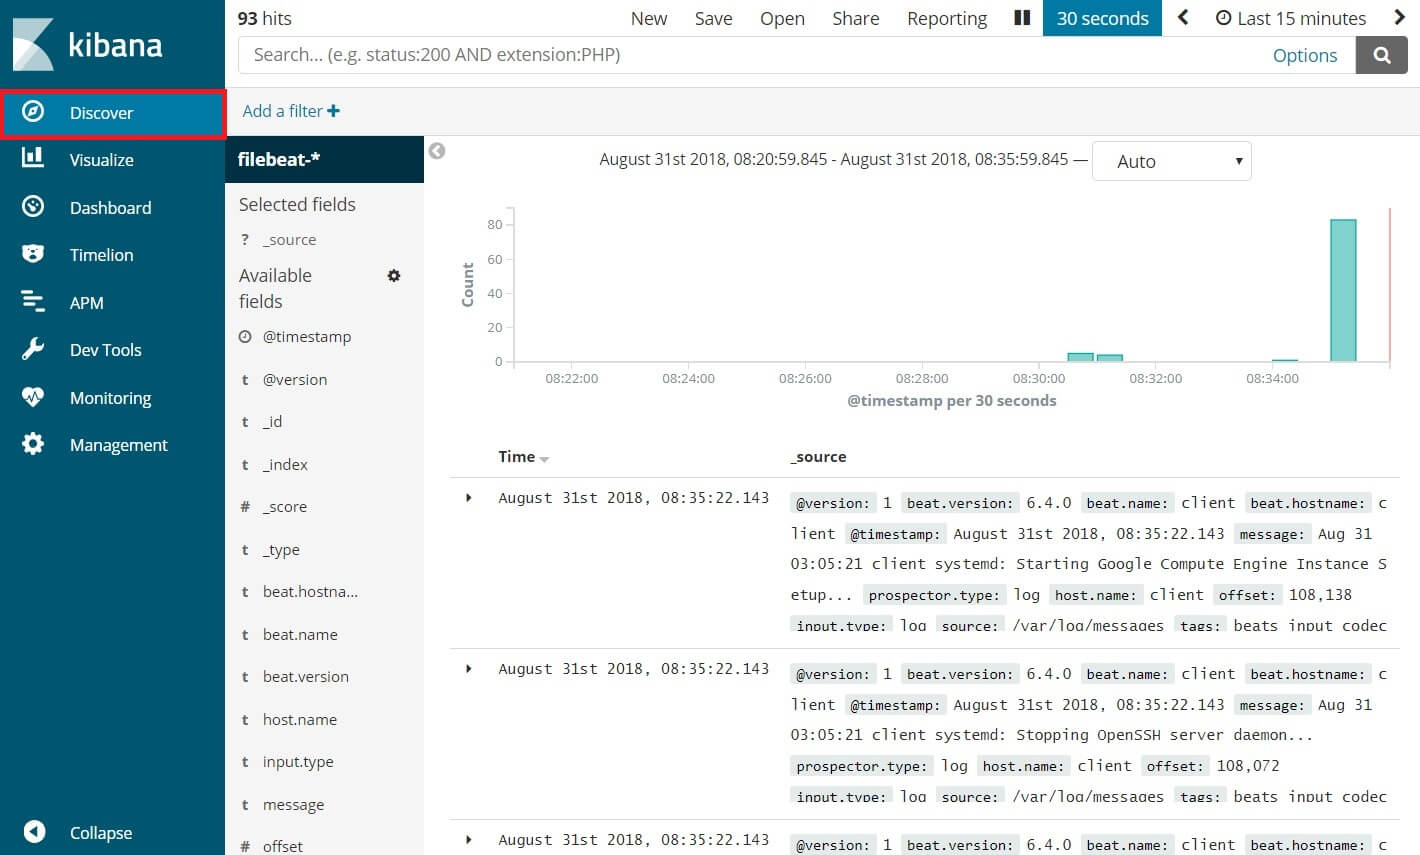
Now, click Discover to view the incoming logs and perform search queries.
That’s All.
