ELK stack is also known as the Elastic stack, consists of four open source projects: Elasticsearch, Logstash, Kibana, and Beats. It helps you to have all of your logs stored in one place and provides an ability to analyze and visualize data or the issues by correlating the events at a particular time.
This guide helps you to install ELK stack on RHEL 8.
Components
Elasticsearch – An open source, full-text search engine. It stores incoming logs from Logstash and offers the ability to search the logs/data in a real-time
Logstash – It does the data processing (Collect, enrich and transform) of incoming logs sent by beats (forwarder) and sends it to Elasticsearch
Kibana – Provides visualization of data or logs from Elasticsearch.
Beats – Installed on client machines, it collects and sends logs to Logstash through beats protocol.
Environment
To have a full-featured ELK stack, we would need two machines to test the collection of logs.
| Host Name | OS | IP Address | Purpose |
|---|---|---|---|
| elk.itzgeek.local | RHEL 8 | 192.168.1.10 | ELK Stack |
| client.itzgeek.local | CentOS 7 | 192.168.1.20 | Client Machine (Filebeat) |
Prerequisites
Install Java
Since Elasticsearch is based on Java, we need to have either OpenJDK or Oracle JDK is installed on your machine.
READ: How to Install Java on RHEL 8
Here, I am using OpenJDK 1.8.
yum -y install java
Verify the Java version.
java -version
Output:
openjdk version "1.8.0_212"
OpenJDK Runtime Environment (build 1.8.0_212-b04)
OpenJDK 64-Bit Server VM (build 25.212-b04, mixed mode)
Configure ELK repository
Import the Elastic signing key.
rpm --import https://artifacts.elastic.co/GPG-KEY-elasticsearch
Setup the Elasticsearch repository on both ELK server and the client.
cat << EOF > /etc/yum.repos.d/elastic.repo
[elasticsearch-7.x]
name=Elasticsearch repository for 7.x packages
baseurl=https://artifacts.elastic.co/packages/oss-7.x/yum
gpgcheck=1
gpgkey=https://artifacts.elastic.co/GPG-KEY-elasticsearch
enabled=1
autorefresh=1
type=rpm-md
EOF
Install & Configure Elasticsearch
Elasticsearch is an open source, the full-text search engine offers a real-time distributed search and analytics with the RESTful web interface. Elasticsearch stores all the data are sent by the Logstash and displays through the web interface (Kibana) on users request.
Install Elasticsearch.
yum install -y elasticsearch-oss
Edit the Elasticsearch’s configuration file to
vi /etc/elasticsearch/elasticsearch.yml
Set the cluster name, node name, listening IP address as per your environment.
cluster.name: elkstack

node.name: elk.itzgeek.local

network.host: 192.168.1.10
If you set listening IP address, you need to define seed hosts and initial master nodes.
discovery.seed_hosts: ["elk.itzgeek.local"]

cluster.initial_master_nodes: ["elk.itzgeek.local"]
Configure Elasticsearch to start during system startup.
systemctl daemon-reload

systemctl enable elasticsearch

systemctl start elasticsearch
Use CURL to check if the Elasticsearch is responding to the queries.
curl -X GET https://192.168.1.10:9200
Output:
{
  "name" : "elk.itzgeek.local",
  "cluster_name" : "elkstack",
  "cluster_uuid" : "yws_6oYKS965bZ7GTh0e6g",
  "version" : {
    "number" : "7.2.0",
    "build_flavor" : "oss",
    "build_type" : "rpm",
    "build_hash" : "508c38a",
    "build_date" : "2019-06-20T15:54:18.811730Z",
    "build_snapshot" : false,
    "lucene_version" : "8.0.0",
    "minimum_wire_compatibility_version" : "6.8.0",
    "minimum_index_compatibility_version" : "6.0.0-beta1"
  },
  "tagline" : "You Know, for Search"
}
Check the cluster health by running the below command.
curl -XGET '192.168.1.10:9200/_cluster/health?pretty'
Output: Cluster status should be green.
{
  "cluster_name" : "elkstack",
  "status" : "green",
  "timed_out" : false,
  "number_of_nodes" : 1,
  "number_of_data_nodes" : 1,
  "active_primary_shards" : 0,
  "active_shards" : 0,
  "relocating_shards" : 0,
  "initializing_shards" : 0,
  "unassigned_shards" : 0,
  "delayed_unassigned_shards" : 0,
  "number_of_pending_tasks" : 0,
  "number_of_in_flight_fetch" : 0,
  "task_max_waiting_in_queue_millis" : 0,
  "active_shards_percent_as_number" : 100.0
}
Install & Configure Logstash
Logstash is an open source tool for managing logs. It collects the logs, parse them and store them on Elasticsearch. Over 160+ plugins are available for Logstash which offers the capability of processing the different type of events with no extra work.
Install the Logstash package.
yum -y install logstash-oss
Logstash configuration can be found in /etc/logstash/conf.d/.
Logstash configuration file consists of three sections namely input, filter, and the output. All three sections can be found in a single file or separate files end with .conf.
I recommend you to use a single file for placing input, filter and output sections.
vi /etc/logstash/conf.d/beats.conf
In the input section, we will configure Logstash to listen on port 5044 for incoming logs from the beats (forwarder) that is installed on client machines.
input {
  beats {
    port => 5044
  }
}
In the filter section, we will use Grok to parse the logs ahead of sending it to Elasticsearch.
The following grok filter will look for the syslog labeled logs and tries to parse them to make a structured index. This filter is quite useful just to monitor syslog (/var/log/messages) messages.
filter {
  if [type] == "syslog" {
     grok {
        match => { "message" => "%{SYSLOGLINE}" }
  }
     date {
        match => [ "timestamp", "MMM  d HH:mm:ss", "MMM dd HH:mm:ss" ]
     }
  }
}
For more filter patterns, visit grokdebugger page.
In the output section, we will define the location where the logs to get stored, obviously, an Elasticsearch node.
output {
  elasticsearch {
    hosts => ["192.168.1.10:9200"]
    index => "%{[@metadata][beat]}-%{+YYYY.MM.dd}"
  }
}
Now start and enable the Logstash service.
systemctl start logstash

systemctl enable logstash
Wait for a minute to allow Logstash to start and then run the below command to check if it is listening on port 5044.
netstat -antup | grep -i 5044
Output:
tcp6 0 0 :::5044 :::* LISTEN 31014/java
You can troubleshoot Logstash with the help of logs.
cat /var/log/logstash/logstash-plain.log
Install & Configure Kibana
Kibana provides visualization of logs stored on the Elasticsearch. Install the Kibana using the following command.
yum -y install kibana-oss
Edit the kibana.yml file.
vi /etc/kibana/kibana.yml
By default, Kibana listens on localhost which means you can not access Kibana from external machines. To allow it, edit the below line and mention your ELK server’s IP.
server.host: "0.0.0.0"
Uncomment the following line and update it with the Elasticsearch instance URL.
elasticsearch.hosts: ["https://192.168.1.10:9200"]
Start and enable kibana on system startup.
systemctl start kibana

systemctl enable kibana
Check if Kibana is listening on port 5601.
netstat -antup | grep -i 5601
Output:
tcp 0 0 0.0.0.0:5601 0.0.0.0:* LISTEN 3631/node
Firewall
Configure a firewall on the ELK server to receive the logs from client machines.
5044 – For Logstash to receive the logs
5061 – To access the Kibana from external machines.
firewall-cmd --permanent --add-port=5044/tcp

firewall-cmd --permanent --add-port=5601/tcp

firewall-cmd --reload
Next, we will configure beats to ship the logs to Logstash server.
Install and Configure Filebeat
There are four beats clients available
- Packetbeat – Analyze network packet data.
- Filebeat – Real-time insight into log data.
- Topbeat – Get insights from infrastructure data.
- Metricbeat – Ship metrics to Elasticsearch.
Set up the Elastic repository on the client machine to get Filebeat package.
Install Filebeat using the following command.
yum -y install filebeat
Filebeat configuration file is in YAML format, which means indentation is very important. Ensure you use the same number of spaces used in the guide.
Edit filebeat configuration file.
vi /etc/filebeat/filebeat.yml
Comment out the section output.elasticsearch: as we are not going to store logs directly to Elasticsearch.
#-------------------------- Elasticsearch output ------------------------------
#output.elasticsearch:
  # Array of hosts to connect to.
  #hosts: ["localhost:9200"]

  # Optional protocol and basic auth credentials.
  #protocol: "https"
  #username: "elastic"
  #password: "changeme"
Now, find the line output.logstash and modify the entries like below. This section defines filebeat to send logs to Logstash server 192.168.1.10 on port 5044.
.   .   .

#----------------------------- Logstash output --------------------------------
output.logstash:
  # The Logstash hosts
  hosts: ["192.168.1.10:5044"]
.   .   .
On top of /etc/filebeat/filebeat.yml, you would see the prospectors section. Here, you need to specify which logs should be sent to Logstash.
Each prospector starts with a – character.
Here, we will configure filebeat to send system logs /var/log/messages to Logstash server. To do that, modify the existing prospector under paths section as shown below.
.   .   .

filebeat.inputs:

# Each - is an input. Most options can be set at the input level, so
# you can use different inputs for various configurations.
# Below are the input specific configurations.

- type: log

  # Change to true to enable this input configuration.
  enabled: true

  # Paths that should be crawled and fetched. Glob based paths.
  paths:
    - /var/log/messages
    #- c:\programdata\elasticsearch\logs\*

.  .  .
Restart the service.
systemctl restart filebeat

systemctl enable filebeat
Access Kibana
Access the Kibana using the following URL.
You would get the Kibana’s home page. Click Explore on my own.

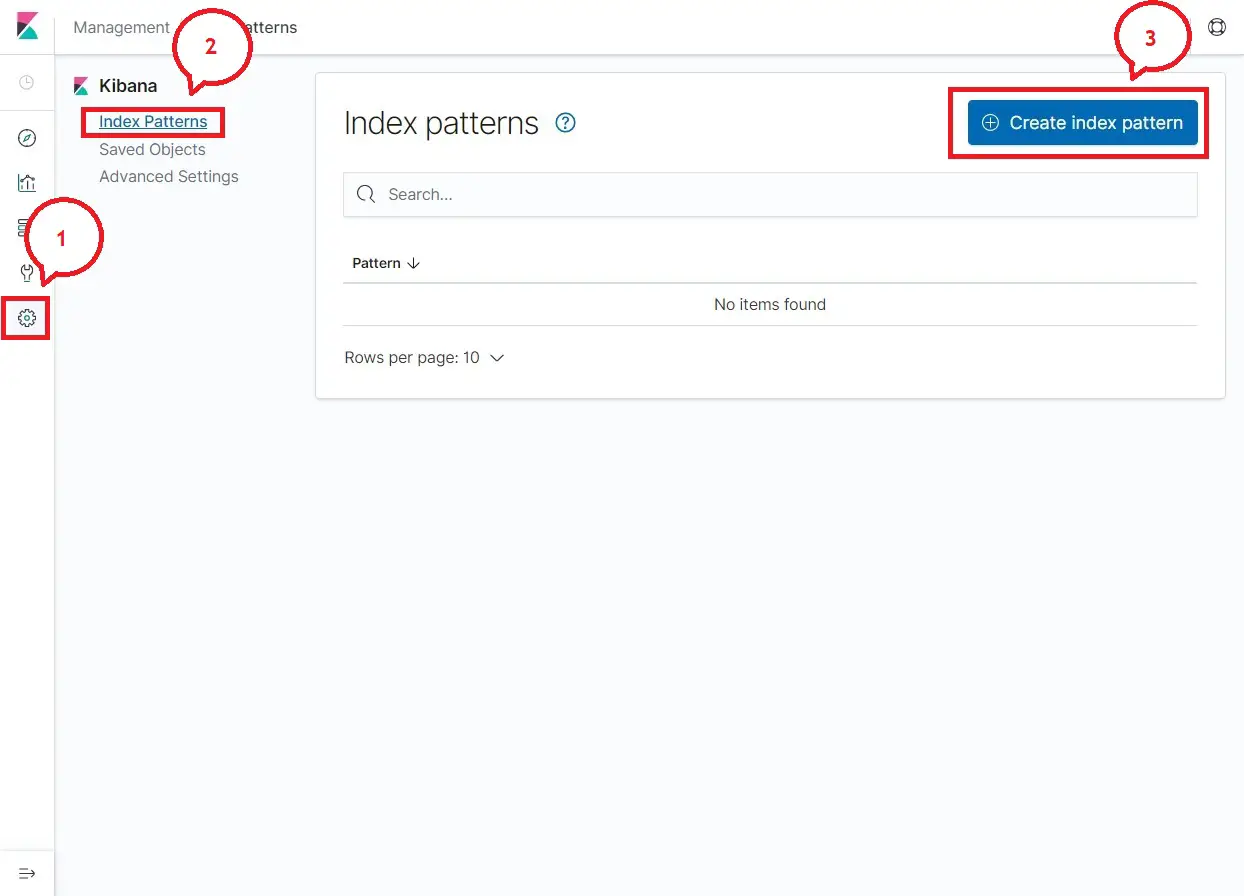
On your first access, you have to map the filebeat index. Go to Management >> Index Patterns >> Create Index Pattern.
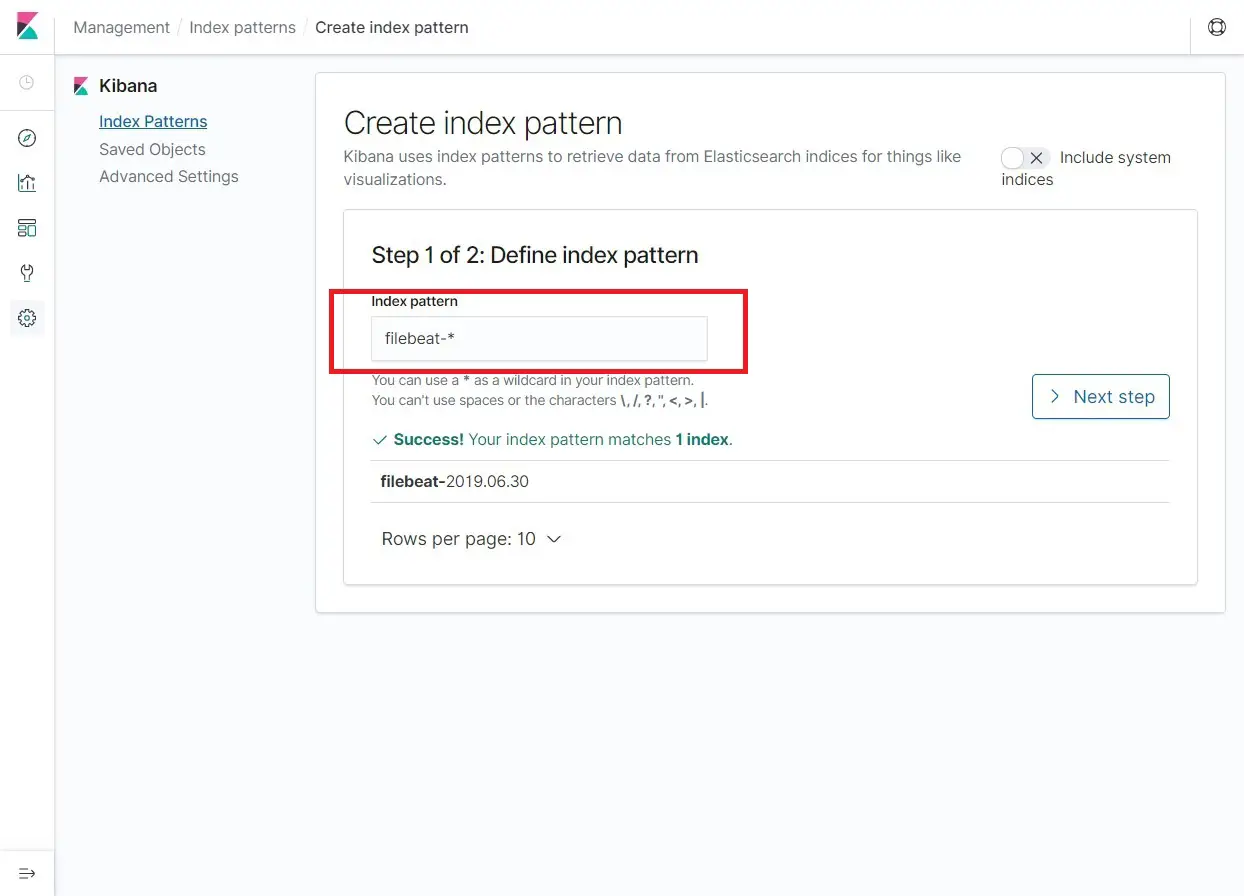
Type the following in the Index pattern box.
filebeat-*
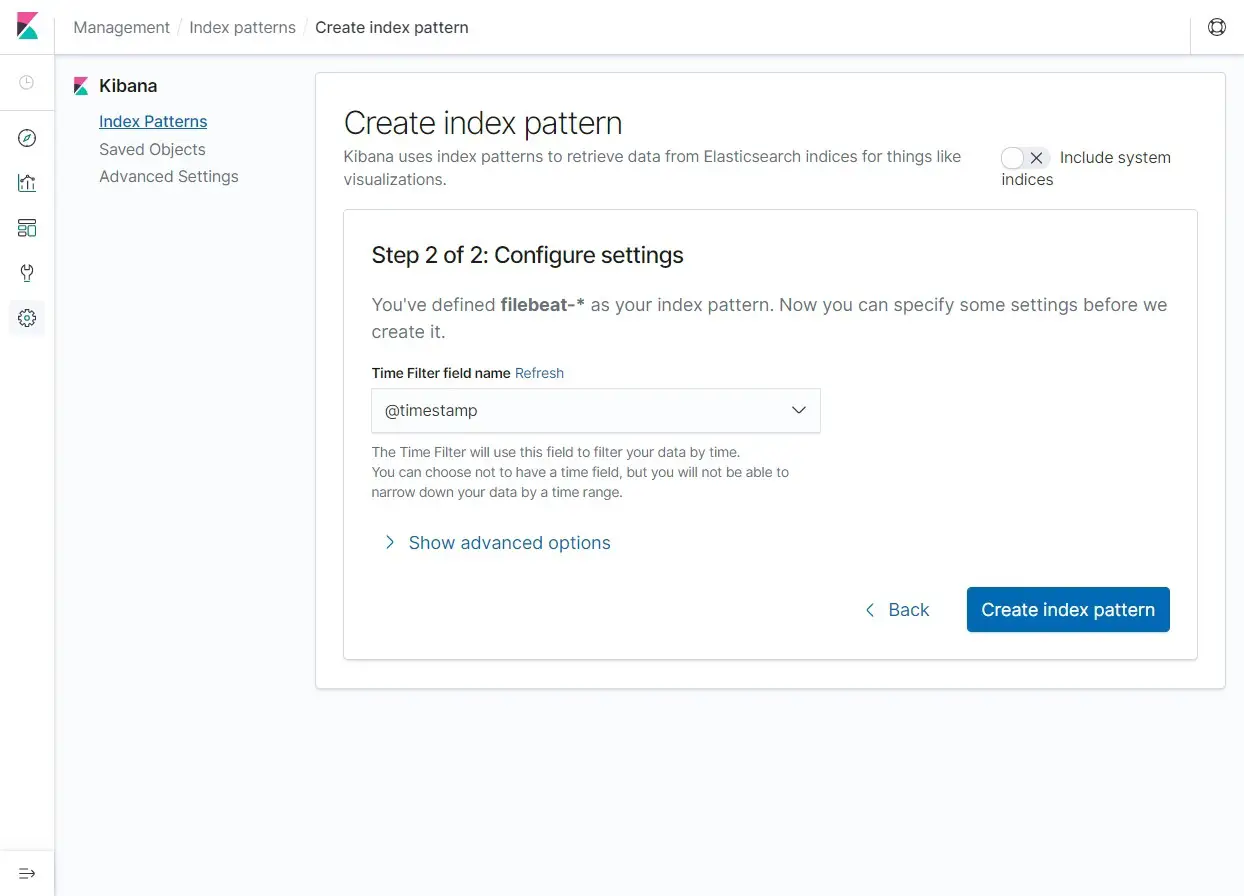
Select @timestamp and then click on Create Index Pattern.
@timestamp
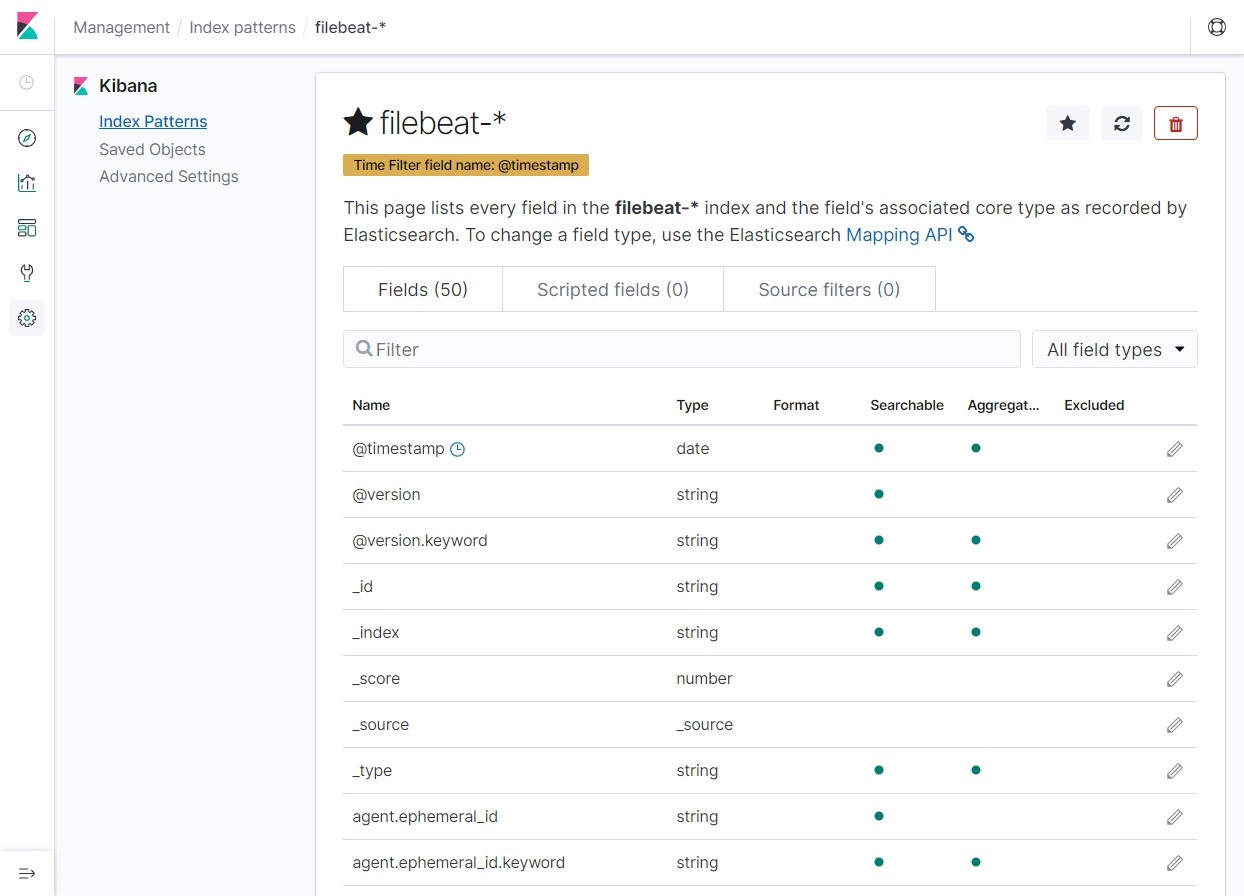
Verify your index patterns and its mappings.
Now, click Discover to view the logs and perform search queries.

Conclusion
That’s All. You have successfully learned how to install ELK Stack on RHEL 8. Please share your feedback in the comments section.