How To Install Elasticsearch, Logstash, and Kibana (ELK Stack) on Ubuntu 18.04 / Ubuntu 16.04
ELK Stack is a full-featured data analytics platform, consists of three open source tools Elasticsearch, Logstash, and Kibana. This stack helps you to store and manage logs centrally and gives an ability to analyze issues by correlating the events on particular time.
This post guides you to install ELK stack on Ubuntu 18.04 / Ubuntu 16.04.
Components
Elasticsearch – Stores incoming logs from Logstash and provides an ability to search the logs/data in a real-time
Logstash – Processing (Collect, enrich and send it to Elasticsearch) of incoming logs sent by beats (forwarder).
Kibana – Provides visualization of events and logs.
Beats – Installed on client machines and it sends logs to Logstash or Elasticsearch through beats protocol.
Prerequisites
Install Java
Elasticsearch requires either OpenJDK or Oracle JDK available on your machine.
Here, for this demo, I am using OpenJDK. Install Java using the below command along with wget and HTTPS support package for APT.
sudo apt update
sudo apt install -y openjdk-8-jdk wget apt-transport-https
Check the Java version.
java -version
Output:
openjdk version "1.8.0_181"
OpenJDK Runtime Environment (build 1.8.0_181-8u181-b13-0ubuntu0.18.04.1-b13)
OpenJDK 64-Bit Server VM (build 25.181-b13, mixed mode)
If you want to use Oracle Java JDK, then read.
READ: Install Oracle Java JDK 10 / 8 on Ubuntu 18.04
READ: Install Oracle Java JDK 8 on Ubuntu 16.04
Configure ELK repository
ELK stack packages can be easily obtained from Elastic CO by setting up its official repository.
wget -qO - https://artifacts.elastic.co/GPG-KEY-elasticsearch | sudo apt-key add -
echo "deb https://artifacts.elastic.co/packages/6.x/apt stable main" | sudo tee -a /etc/apt/sources.list.d/elastic-6.x.list
Install Elasticsearch
We will now install Elasticsearch server, an open-source search engine based on Lucene. It provides real-time distributed, multitenant-capable full-text search engine with a web interface (HTTP) and schema-free JSON documents.
Install Elasticsearch using the following command, v6.4 at the time of writing this article.
sudo apt update
sudo apt install -y elasticsearch
Start the Elasticsearch service.
sudo systemctl start elasticsearch
sudo systemctl enable elasticsearch
Wait for few minutes and run the below command to see the status of Elasticsearch REST interface.
curl -X GET https://localhost:9200
Output:
{
  "name" : "nqS7TFZ",
  "cluster_name" : "elasticsearch",
  "cluster_uuid" : "vERyh1VpR46G9T21H_3gKQ",
  "version" : {
    "number" : "6.4.0",
    "build_flavor" : "default",
    "build_type" : "deb",
    "build_hash" : "595516e",
    "build_date" : "2018-08-17T23:18:47.308994Z",
    "build_snapshot" : false,
    "lucene_version" : "7.4.0",
    "minimum_wire_compatibility_version" : "5.6.0",
    "minimum_index_compatibility_version" : "5.0.0"
  },
  "tagline" : "You Know, for Search"
}
The above output confirms that Elasticsearch is up and running fine.
Install Logstash
Logstash is an open-source data-collection and log-parsing engine. It collects logs, parse and store them on Elasticsearch for searching. Over 160+ plugins are available for Logstash which provides the capability of processing a different type of events with no extra work.
sudo apt install -y logstash
Create SSL certificate for Logstash (Optional)
It is optional to set the Forwarder (Filebeat) which we install on client machines to use SSL certificate for secure transmission of logs.
Create the SSL certificate either with the hostname or IP SAN.
Option 1: (Hostname or FQDN)
Go to the OpenSSL directory.
cd /etc/ssl/
Now, create the SSL certificate using OpenSSL. Replace server.itzgeek.local with the hostname of your Logstash server.
sudo openssl req -x509 -nodes -newkey rsa:2048 -days 365 -keyout logstash-forwarder.key -out logstash-forwarder.crt -subj /CN=server.itzgeek.local
This logstash-forwarder.crt should be copied to all client servers those who send logs to logstash server.
Option 2: (IP Address)
Follow the below steps to create an SSL certificate for IP SAN.
As a prerequisite, add the IP address of Logstash server to SubjectAltName in the OpenSSL configuration file.
sudo nano /etc/ssl/openssl.cnf
Look for [ v3_ca ] section and update subjectAltName with the IP Address of your Logstash server.
subjectAltName = IP:192.168.1.10
Goto OpenSSL directory.
cd /etc/ssl/
Now, create the SSL certificate by running following command.
sudo openssl req -x509 -days 365 -batch -nodes -newkey rsa:2048 -keyout logstash-forwarder.key -out logstash-forwarder.crt
This logstash-forwarder.crt should be copied to all client servers those who send logs to logstash server.
Convert SSL
Convert the current key to PKCS8 format for Logstash to work properly.
sudo openssl pkcs8 -in logstash-forwarder.key -topk8 -nocrypt -out logstash-forwarder.key.pem
Change the file permission to world readable.
sudo chmod 644 /etc/ssl/logstash-forwarder.key.pem
Configure Logstash
Logstash configuration consists of three sections, namely input, filter, and the output. You can put all sections in a single file or separate file for each section, end with .conf.
Here, we will use a single file for placing input, filter and output sections. Create a configuration file under /etc/logstash/conf.d/ directory.
sudo nano /etc/logstash/conf.d/logstash.conf
In the input section, we will configure Logstash to listen on port 5044 for incoming logs, from beats (Forwarder) that sit on client machines.
Also, add the SSL certificate details in the input section for secure communication.
input {
 beats {
   port => 5044

   # Set to False if you do not SSL
   ssl => true

   # Delete below lines if no SSL is used
   ssl_certificate => "/etc/ssl/logstash-forwarder.crt"
   ssl_key => "/etc/ssl/logstash-forwarder.key.pem"
   }
}
In the filter section. We will use Grok to parse logs ahead of sending it to Elasticsearch, for storing.
The following grok filter will look for logs labeled syslog and tries to parse them to make a structured index.
filter {
if [type] == "syslog" {
    grok {
      match => { "message" => "%{SYSLOGLINE}" }
    }

    date {
match => [ "timestamp", "MMM  d HH:mm:ss", "MMM dd HH:mm:ss" ]
}
  }

}
For more GROK filter patterns, take a look at here.
In the output section, we will define where logs to get stored, obviously Elasticsearch in case of ELK stack.
output {
 elasticsearch {
  hosts => localhost
    index => "%{[@metadata][beat]}-%{+YYYY.MM.dd}"
       }
stdout {
    codec => rubydebug
       }
}
Now start and enable the Logstash service.
sudo systemctl restart logstash
sudo systemctl enable logstash
Logstash logs:
sudo cat /var/log/logstash/logstash-plain.log
Install and Configure Kibana
Kibana provides visualization of data stored on Elasticsearch. Install Kibana using the following command.
sudo apt install -y kibana
To enale the access, edit /etc/kibana/kibana.yml file.
sudo nano /etc/kibana/kibana.yml
Make changes to the below line with your server IP address.
server.host: "192.168.1.10"
Also, some cases Elasticsearch and Kibana run on different machines, so update the below line with IP address of Elasticsearch server.
elasticsearch.url: "https://localhost:9200"
Start and enable Kibana on machine startup.
sudo systemctl restart kibana
sudo systemctl enable kibana
Install Beats
There are four beat clients available.
Packetbeat – Analyze network packet data.
Filebeat – Real-time insight into log data.
Topbeat – Get insights from infrastructure data.
Metricbeat – Ship metrics to Elasticsearch.
Ensure that client machines can resolve the hostname of the Logstash server. If your environment doesn’t have a DNS server, then you would need to add a host entry for Logstash server on the client machine.
sudo nano /etc/hosts
Make an entry something like below.
192.168.1.10 server.itzgeek.local
Install Filebeat
Filebeat is a software agent that runs on the remote client machine, and it sends logs to Logstash server for parsing or Elasticsearch for storing depends on the configuration.
Install HTTPS support for apt.
sudo apt update
sudo apt install -y apt-transport-https
Filebeat is available on the Elastic repository, so you need to setup it for Filebeat installation.
wget -qO - https://artifacts.elastic.co/GPG-KEY-elasticsearch | sudo apt-key add -
echo "deb https://artifacts.elastic.co/packages/6.x/apt stable main" | sudo tee -a /etc/apt/sources.list.d/elastic-6.x.list
Install Filebeat using the following command.
sudo apt update
sudo apt install -y filebeat
Configure Filebeat
First, copy the logstash-forwarder.crt file on to the remote client machine.
scp -pr [email protected]:/etc/ssl/logstash-forwarder.crt /etc/ssl
Edit the filebeat configuration file /etc/filebeat/filebeat.yml to send logs to Logstash server.
sudo nano /etc/filebeat/filebeat.yml
Below configuration is to send system logs (/var/log/syslog) to Logstash server. For this demo, I have commented out /var/log/*.log to avoid sending all logs to Logstash server.
.  .  .
filebeat.inputs:

# Each - is an input. Most options can be set at the input level, so
# you can use different inputs for various configurations.
# Below are the input specific configurations.

- type: log

  # Change to true to enable this input configuration.
  enabled: true

  # Paths that should be crawled and fetched. Glob based paths.
  paths:
    - /var/log/syslog
    #- /var/log/*.log
.  .  .
Now, find the line output.logstash: and modify entries to send system logs to Logstash and also mention the location of the SSL certificate.
.   .   .

output.logstash:

    hosts: ["server.itzgeek.local:5044"]

    # Comment out this line if you are not using SSL on Logstash server
    ssl.certificate_authorities: ["/etc/ssl/logstash-forwarder.crt"]

.   .   .
Restart the Filebeat service.
sudo systemctl restart filebeat
Filebeat’s log is typically found in its log file.
sudo cat /var/log/filebeat/filebeat
Access Kibana Interface
Access the Kibana web interface by going to the following URL.
OR
You would get the Kibana’s home page.
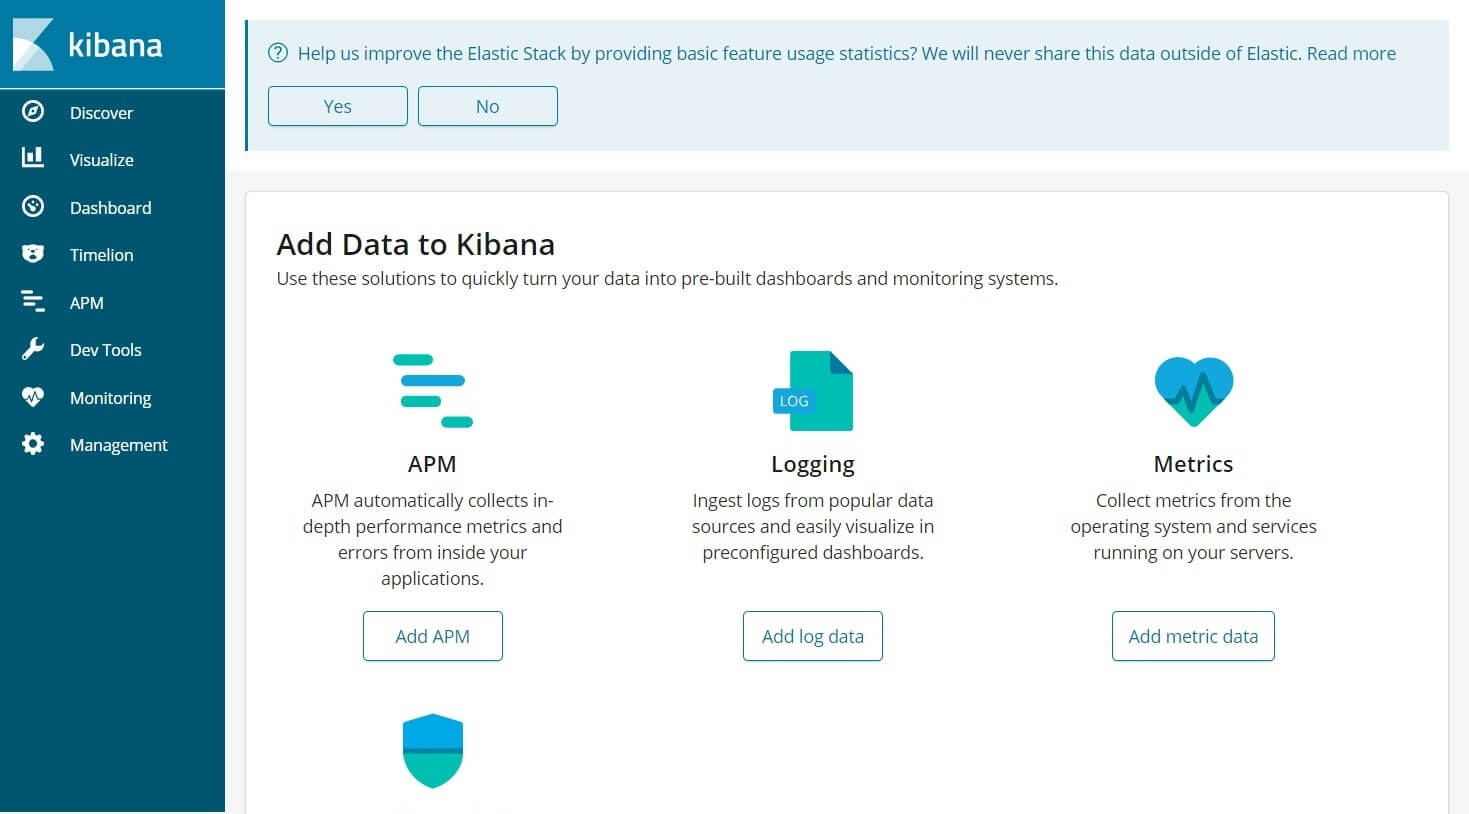
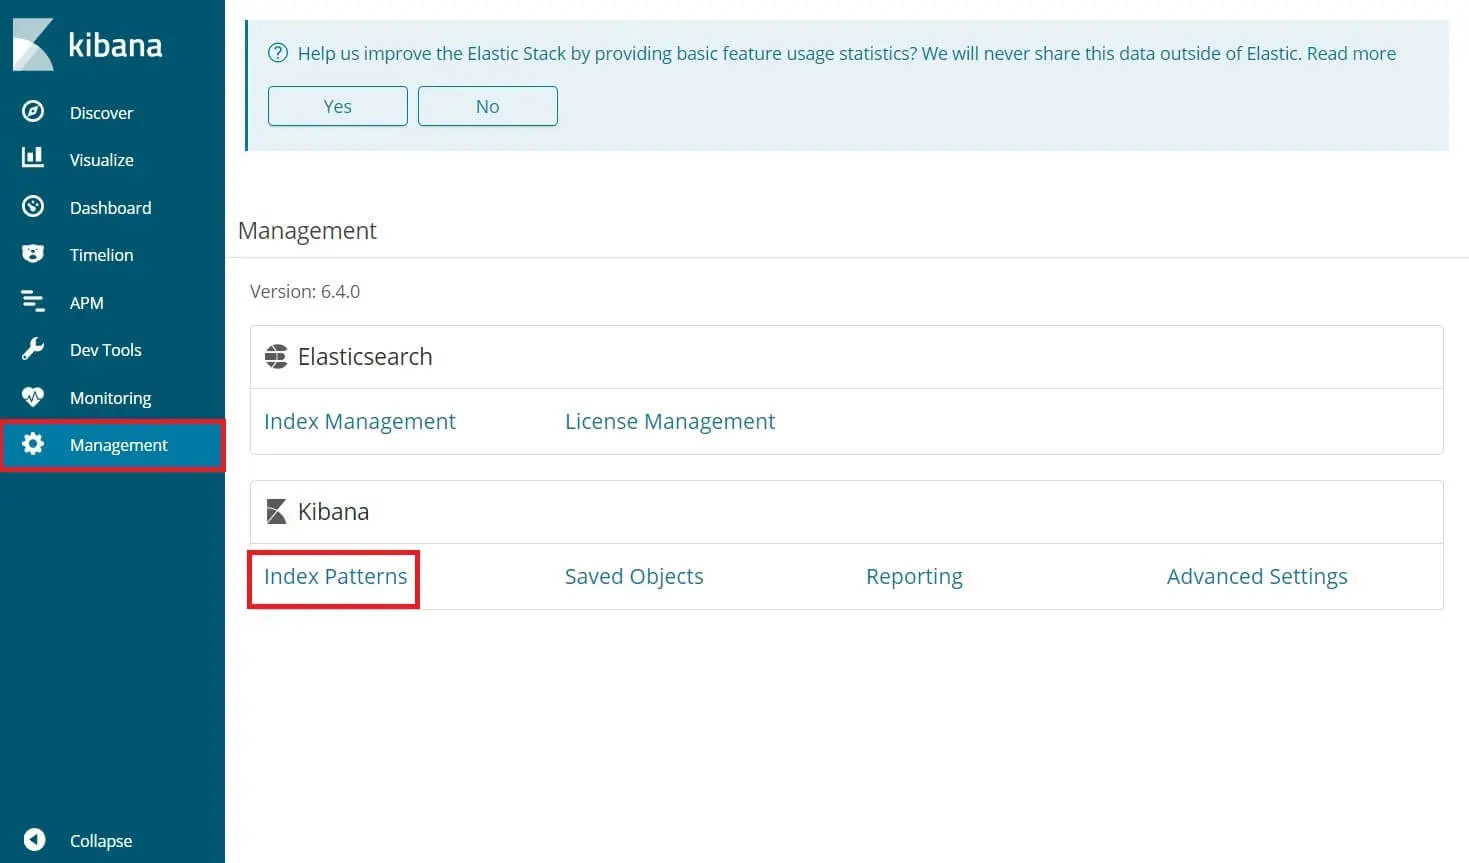
On your first access, you need to map the filebeat index. Go to Management >> Index Patterns.
Type the following in the Index pattern box.
filebeat-*
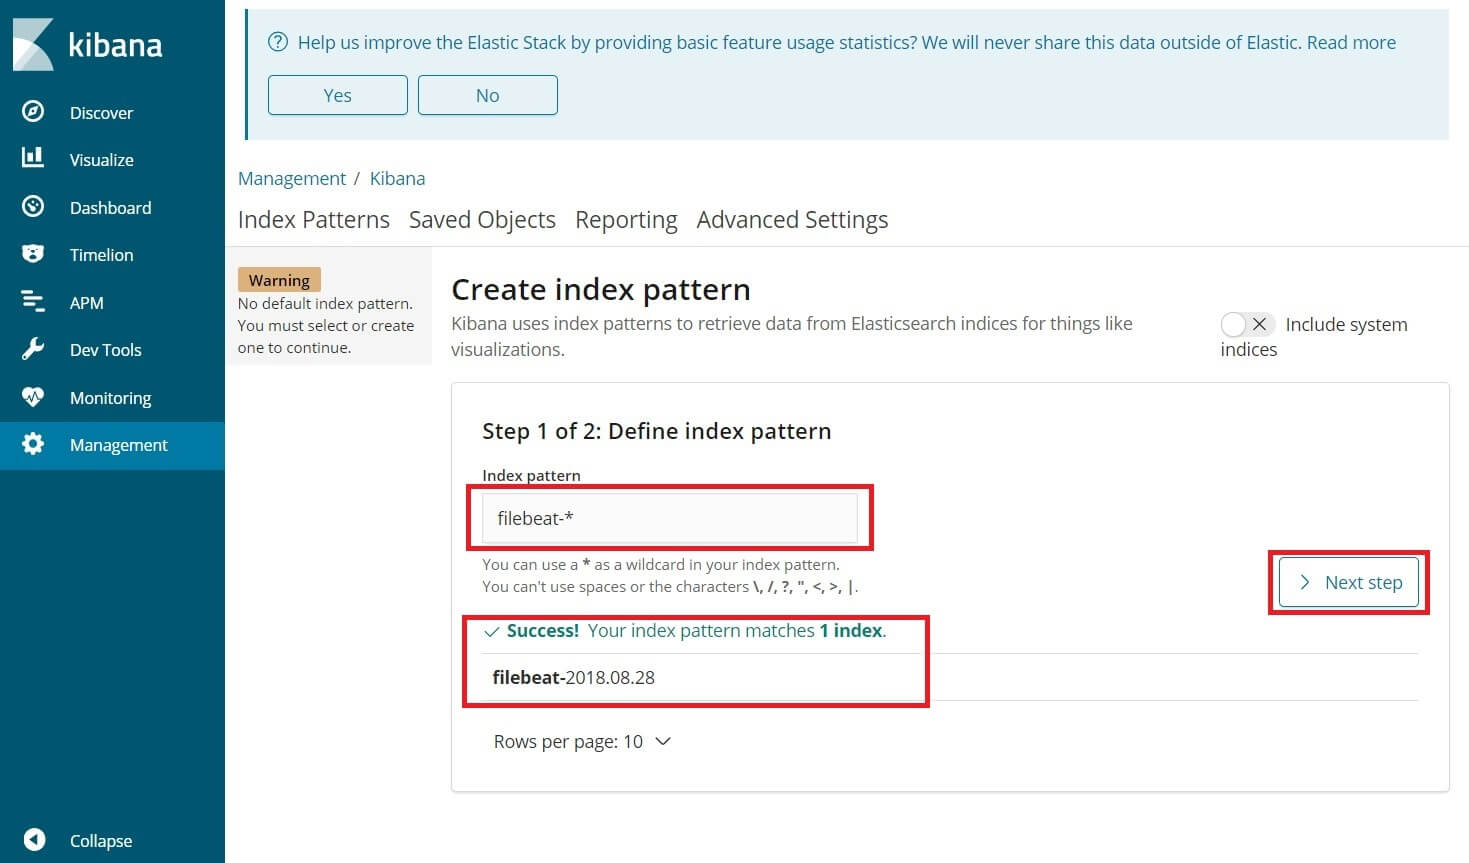
You should see filebeat index something like above. Click Next step.
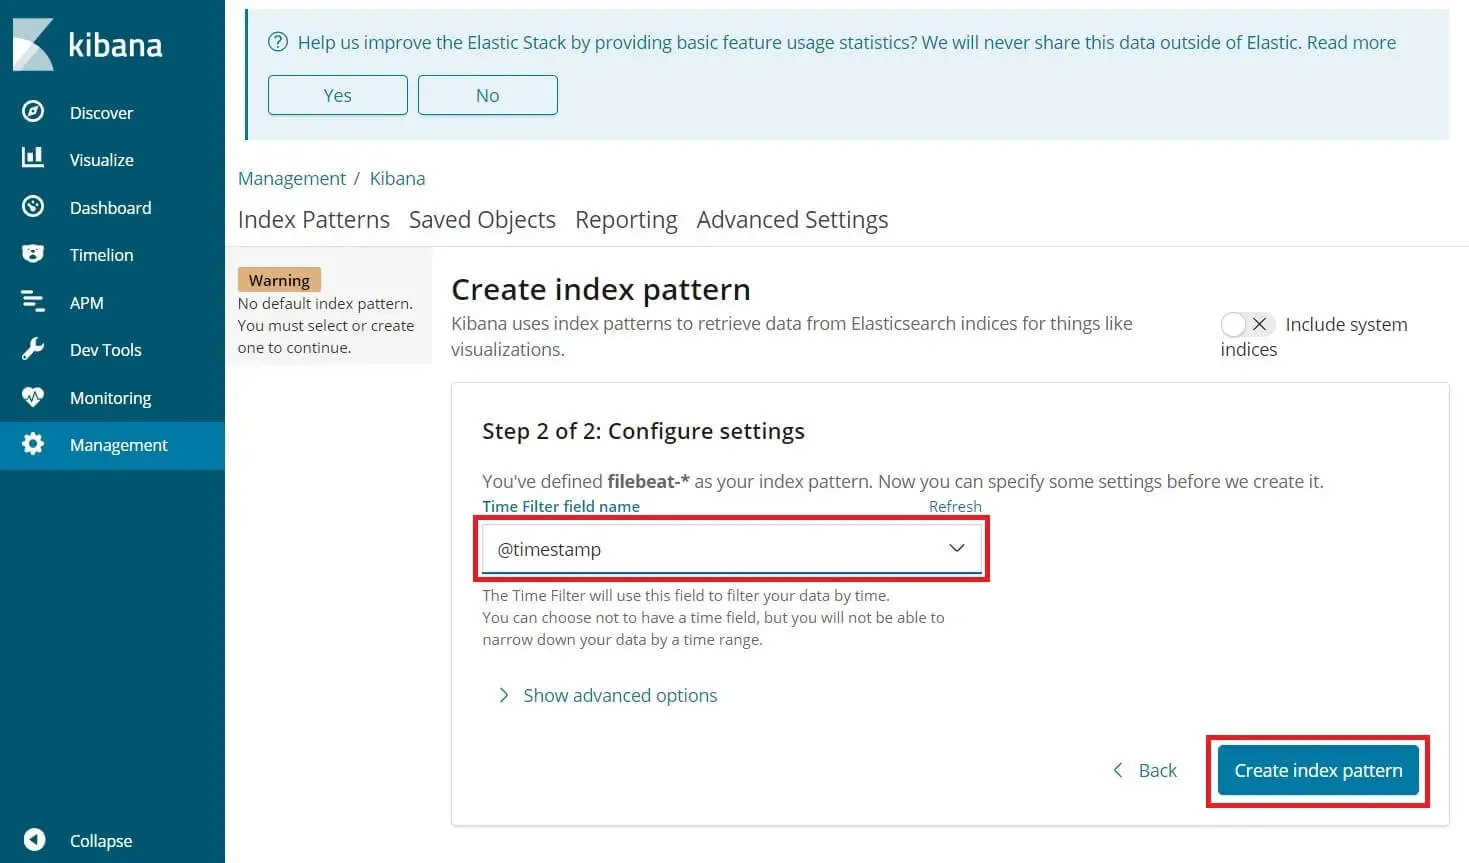
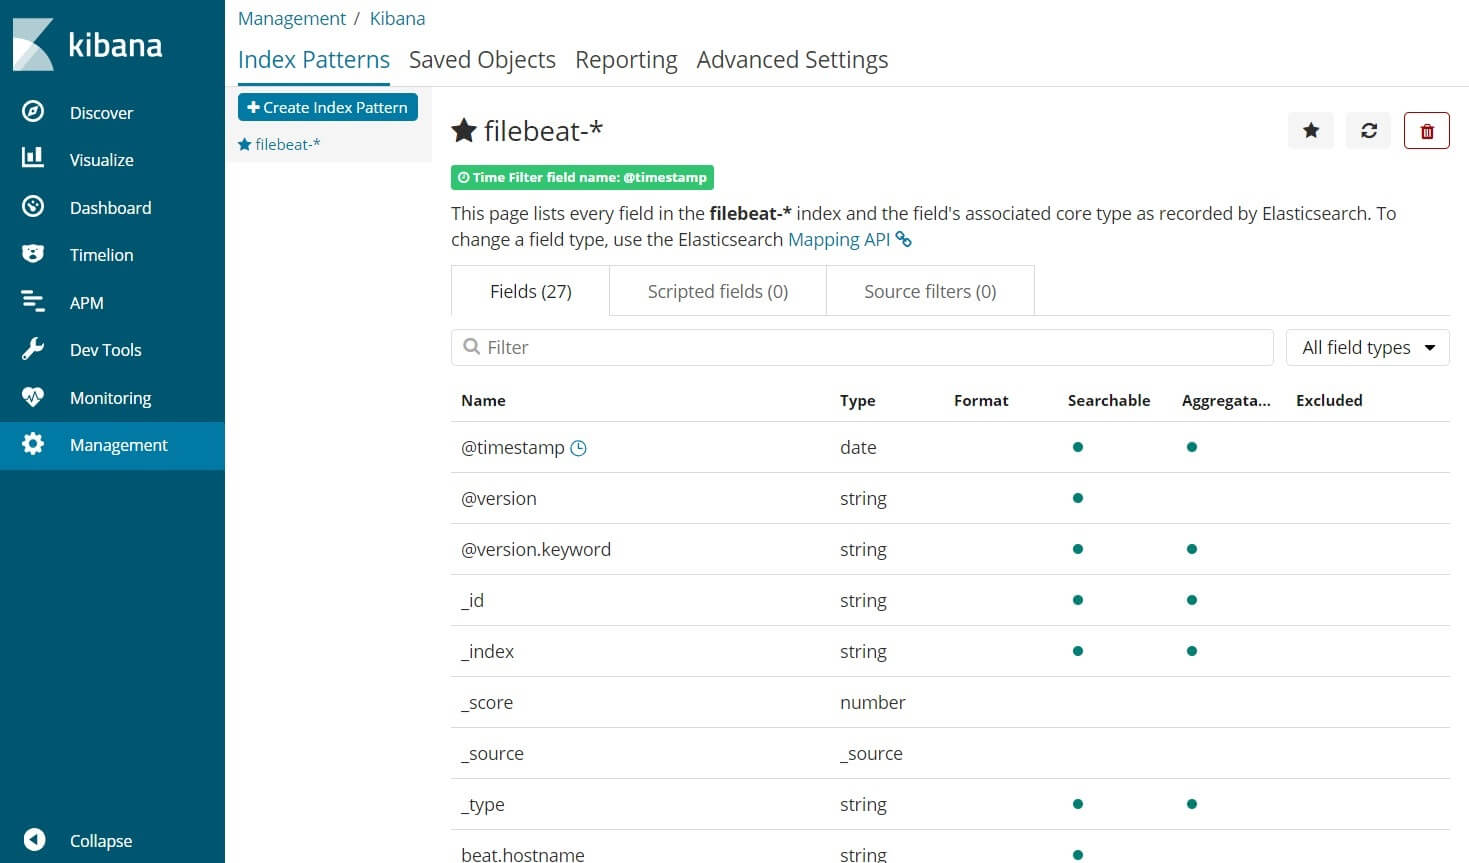
Select @timestamp and then click on Create index pattern.
@timestamp
Check out the index patterns and its mapping.
Click Discover in the left navigation to view the incoming logs from client machines.
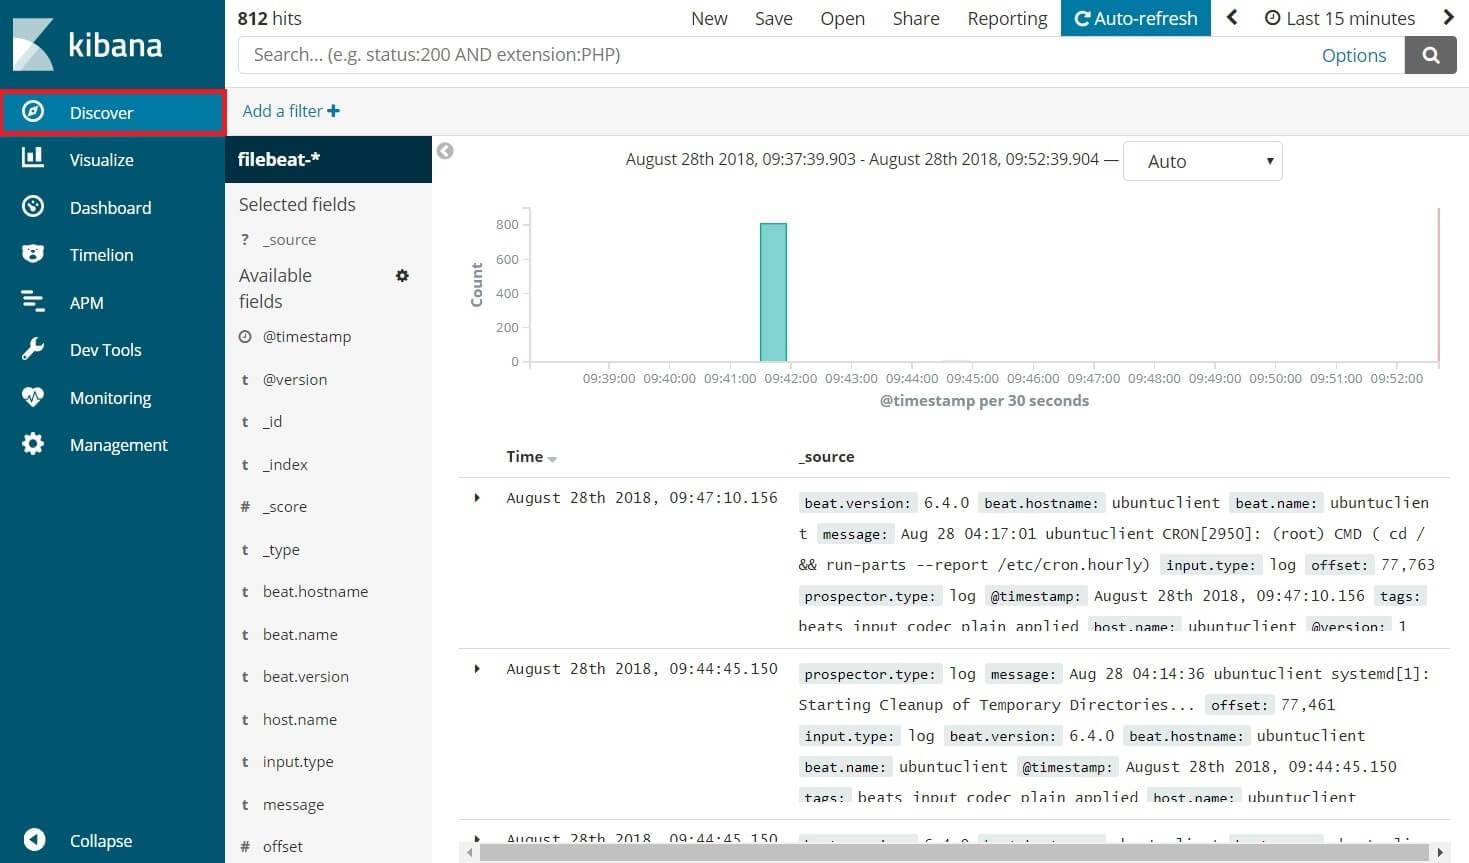
That’s All.