Setup ELK Stack on Ubuntu 16.04 – Install ElasticSearch, Logstash, and Kibana on Ubuntu 16.04
ELK is a full featured data analytics stack, consists of Elasticsearch, Logstash, and Kibana that helps you to store and manage the logs centrally and offers an ability to analyze the issues by correlating the events on a particular time.
This guide helps you to install ELK stack on Ubuntu 16.04.
Components
Logstash – It does the processing (Collect, enrich and send it to Elasticsearch) of incoming logs sent by beats (forwarder).
Elasticsearch – It stores incoming logs from Logstash and provides an ability to search the logs/data in a real time
Kibana – Provides visualization of logs.
Beats – Installed on client machines, send logs to Logstash through beats protocol.
Prerequisites
Switch to the root user.
su -
OR
sudo su -
Since Elasticsearch is based on Java, you need to have OpenJDK or Oracle JDK installed on your machine.
READ: How to install Oracle Java 8 on Ubuntu 16.04 / LinuxMint 18
Here, I choose to install OpenJDK.
apt-get update
apt-get install -y openjdk-8-jdk wget
Check the version of JAVA.
java -version
Output:
openjdk version "1.8.0_131"
OpenJDK Runtime Environment (build 1.8.0_131-8u131-b11-2ubuntu1.16.04.3-b11)
OpenJDK 64-Bit Server VM (build 25.131-b11, mixed mode)
Install Elasticsearch
Elasticsearch is an open-source search server, offers a real-time distributed search and analytics with the RESTful web interface.
Elasticsearch stores all the data that are sent by the logstash and displays through the kibana on users request.
This topic covers configuration settings that are required for ELK. You can also take at Install Elasticsearch on CentOS 7 / Ubuntu 16.04 / Linux Mint 18 for more instruction.
Setup the Elasticsearch repository.
wget -qO - https://artifacts.elastic.co/GPG-KEY-elasticsearch | sudo apt-key add -
echo "deb https://artifacts.elastic.co/packages/5.x/apt stable main" | sudo tee -a /etc/apt/sources.list.d/elk.list
Install Elasticsearch.
apt-get update
apt-get install -y elasticsearch
Configure Elasticsearch to start during system startup.
systemctl enable elasticsearch
systemctl start elasticsearch
Elastisearch should be now listening on 9200 for processing HTTP request; we can use CURL to get the response.
curl -X GET https://localhost:9200
Output:
{
 "name" : "gf5QYAn",
 "cluster_name" : "elasticsearch",
 "cluster_uuid" : "S6gZNkMERpSr-MGXqEFUJw",
 "version" : {
 "number" : "5.5.2",
 "build_hash" : "b2f0c09",
 "build_date" : "2017-08-14T12:33:14.154Z",
 "build_snapshot" : false,
 "lucene_version" : "6.6.0"
 },
 "tagline" : "You Know, for Search"
}
Install Logstash
Logstash is an open source tool, it collects the logs, parse and store them on Elasticsearch for searching. Over 160+ plugins are available for Logstash, which provides the capability of processing a different type of events with no extra work.
Install Logstash using the apt-get command.
apt-get install -y logstash
Create SSL certificate
Forwarder (filebeat) which will be installed on client servers uses SSL certificate to validate the identity of Logstash server for secure communication.
Create SSL certificate either with the hostname or IP SAN.
Option 1: (Hostname FQDN)
If you use the hostname in the beats (forwarder) configuration, make sure you have A record for logstash server; ensure that client machine can resolve the hostname of the logstash server.
If you do not have a nameserver in your environment; make sure you add the host entry for logstash server in client machines as well as in the logstash server.
sudo nano /etc/hosts

192.168.12.10 server.itzgeek.local
Go to the OpenSSL directory.
cd /etc/ssl/
Now, create the SSL certificate. Replace “green” one in with the hostname of your real logstash server.
openssl req -x509 -nodes -newkey rsa:2048 -days 365 -keyout logstash-forwarder.key -out logstash-forwarder.crt -subj /CN=server.itzgeek.local
Option 2: (IP Address)
If you are planning to use IP address instead of hostname, please follow the steps to create a SSL certificate for IP SAN.
As a pre-requisite, we would need to add an IP address of logstash server to SubjectAltName in the OpenSSL config file.
nano /etc/ssl/openssl.cnf
Look for “[ v3_ca ]” section and replace “green” one with the IP of your logstash server.
subjectAltName = IP:192.168.12.10
Goto OpenSSL directory.
cd /etc/ssl/
Now, create a SSL certificate by running following command.
openssl req -x509 -days 365 -batch -nodes -newkey rsa:2048 -keyout logstash-forwarder.key -out logstash-forwarder.crt
This logstash-forwarder.crt should be copied to all client servers those who send logs to logstash server.
Configure Logstash
Logstash configuration can be found in /etc/logstash/conf.d/. If the files don’t exist, create a new one. logstash configuration file consists of three sections input, filter, and the output; all three sections can be found either in a single file or each section will have separate files end with .conf.
I recommend you to use a single file to placing input, filter and output sections.
nano /etc/logstash/conf.d/logstash.conf
In the first section, we will put an entry for input configuration. The following configuration sets Logstash to listen on port 5044 for incoming logs from the beats (forwarder) that sit on client machines. Also, add the SSL certificate details in the input section for secure communication.
input {
 beats {
   port => 5044
   ssl => true
   ssl_certificate => "/etc/ssl/logstash-forwarder.crt"
   ssl_key => "/etc/ssl/logstash-forwarder.key"
   congestion_threshold => "40"
  }
}
In the filter section. We will use Grok to parse the logs ahead of sending it to Elasticsearch. The following grok filter will look for the “syslog” labeled logs and tries to parse them to make a structured index.
filter {
if [type] == "syslog" {
    grok {
      match => { "message" => "%{SYSLOGLINE}" }
    }

    date {
match => [ "timestamp", "MMM  d HH:mm:ss", "MMM dd HH:mm:ss" ]
}
  }

}
Ffor more filter patterns, take a look at grokdebugger page.
In the output section, we will define the location where the logs to get stored; obviously, it should be Elasticsearch.
output {
 elasticsearch {
  hosts => localhost
    index => "%{[@metadata][beat]}-%{+YYYY.MM.dd}"
       }
stdout {
    codec => rubydebug
       }
}
Now start and enable the logstash.
systemctl start logstash
systemctl enable logstash
You can troubleshoot any issues by looking at below log.
cat /var/log/logstash/logstash-plain.log
Next, we will configure beats to ship the logs to logstash server.
Install Filebeat
There are four beats clients available.
- Packetbeat – Analyze network packet data.
- Filebeat – Real-time insight into log data.
- Topbeat – Get insights from infrastructure data.
- Metricbeat – Ship metrics to Elasticsearch.
On Client machine:
To analyze the system logs, we will be using filebeat here. You can download filebeat from the official website, or you can use the following command to install it.
wget -qO - https://artifacts.elastic.co/GPG-KEY-elasticsearch | sudo apt-key add -
echo "deb https://artifacts.elastic.co/packages/5.x/apt stable main" | sudo tee -a /etc/apt/sources.list.d/beats.list
Install Filebeat.
apt-get update
apt-get install -y filebeat
Filebeat (beats) uses SSL certificate for validating logstash server identity, so copy the logstash-forwarder.crt from the logstash server to the client.
$ scp -pr [email protected]:/etc/ssl/logstash-forwarder.crt /etc/ssl
Configure Filebeat
Now, it’s the time to connect filebeat with Logstash; follow up the below steps to get filebeat configured with ELK stack.
Filebeat configuration file is in YAML format, which means indentation is very important. Make sure you use the same number of spaces used in the guide.
Open up the filebeat configuration file.
nano /etc/filebeat/filebeat.yml
On top, you would see Filebeat prospectors. Here, you need to specify what are files should be sent to logstash and how should they be handled. Each prospector starts with – character.
For testing purpose, we will configure filebeat to send /var/log/syslog to Logstash server. To do that, modify the existing prospector under paths section. Comment out the – /var/log/*.log to avoid sending all .log file present in that directory to Logstash.
.  .  .

      paths:

        - /var/log/syslog
        # - /var/log/*.log

.  .  .
In the Outputs section, comment out the section output.elasticsearch: as we are not going to store logs directly to Elasticsearch.
Now, find the line “output.logstash:” and modify the entries like below. This section defines filebeat to send logs to logstash server “server.itzgeek.local” on port “5044” and mention the path where the copied SSL certificate is placed.
Note: Replace “server.itzgeek.local” with IP address in case if you are using IP SAN.
.   .   .

output.logstash:
  # The Logstash hosts
  hosts: ["server.itzgeek.local:5044"]

  # Optional SSL. By default is off.
  # List of root certificates for HTTPS server verifications
  ssl.certificate_authorities: ["/etc/ssl/logstash-forwarder.crt"]

.   .   .
Restart the service.
systemctl restart filebeat
systemctl enable filebeat
Beats logs are typically found in its log file.
cat /var/log/filebeat/filebeat
Install & Configure Kibana
Kibana provides visualization of logs stored on the elasticsearch, download it from the official website or use the following command to setup repository.
apt-get install -y kibana
Edit the kibana.yml file.
nano /etc/kibana/kibana.yml
By default, Kibana listens on localhost which means you can not access Kibana interface from outside machines. To enable it, edit the below line with your machine IP.
server.host: "192.168.12.10"
Uncomment the following line and update it with the Elasticsearch instance URL. In my case, it is localhost.
elasticsearch.url: "https://localhost:9200"
Start and enable kibana on system startup.
systemctl start kibana
systemctl enable kibana
Access the Kibana using the following URL.
OR
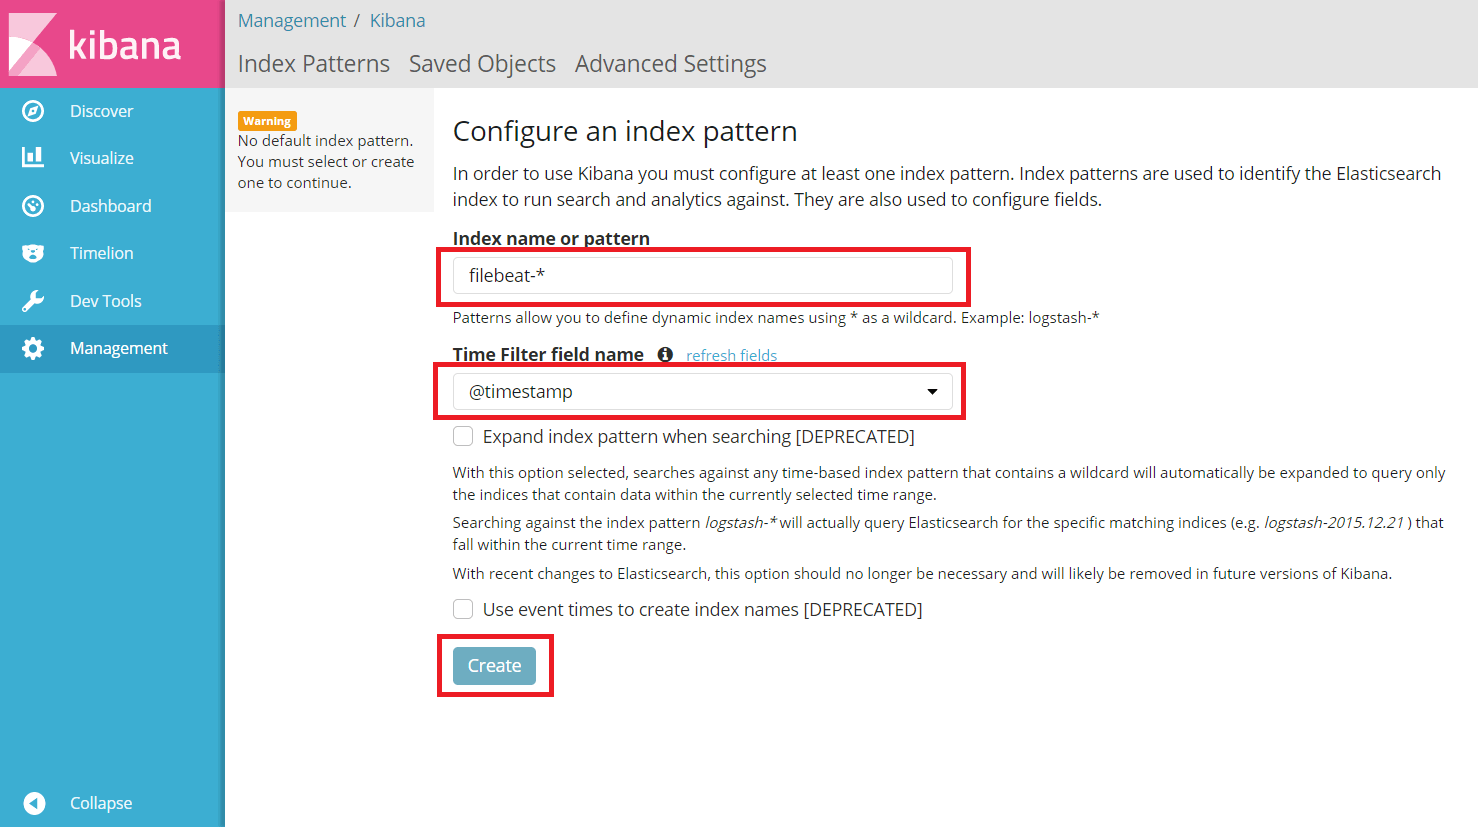
On your first login, you have to map the filebeat index.
Type the following in the Index name or pattern box.
filebeat-*
Select @timestamp and then click on create.
@timestamp
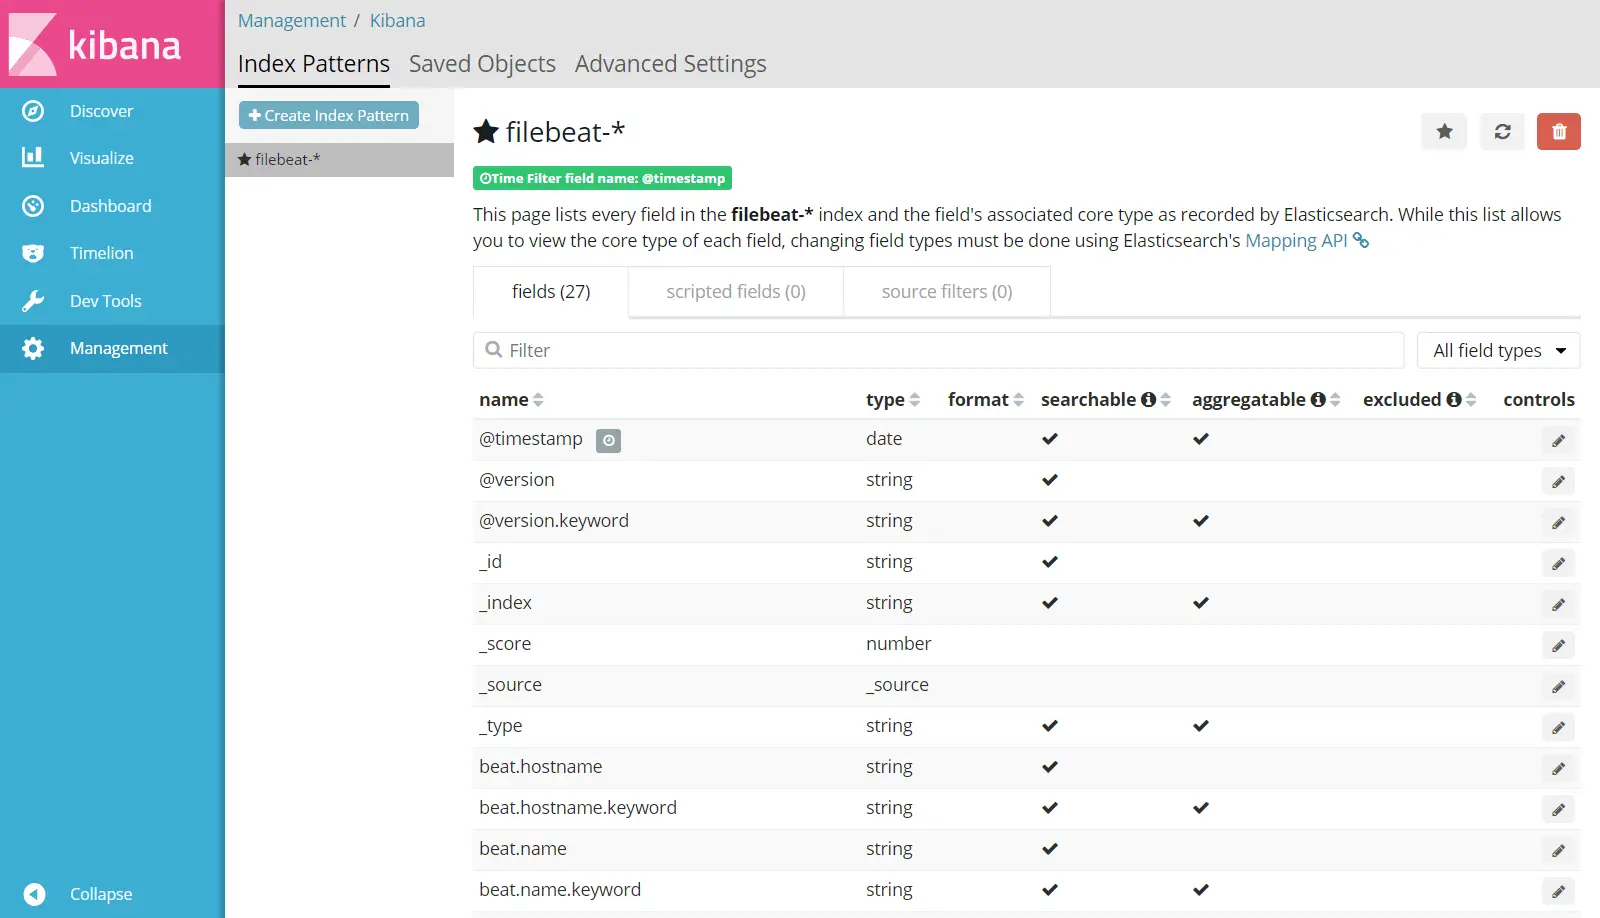
Go through the index patterns and its mapping.
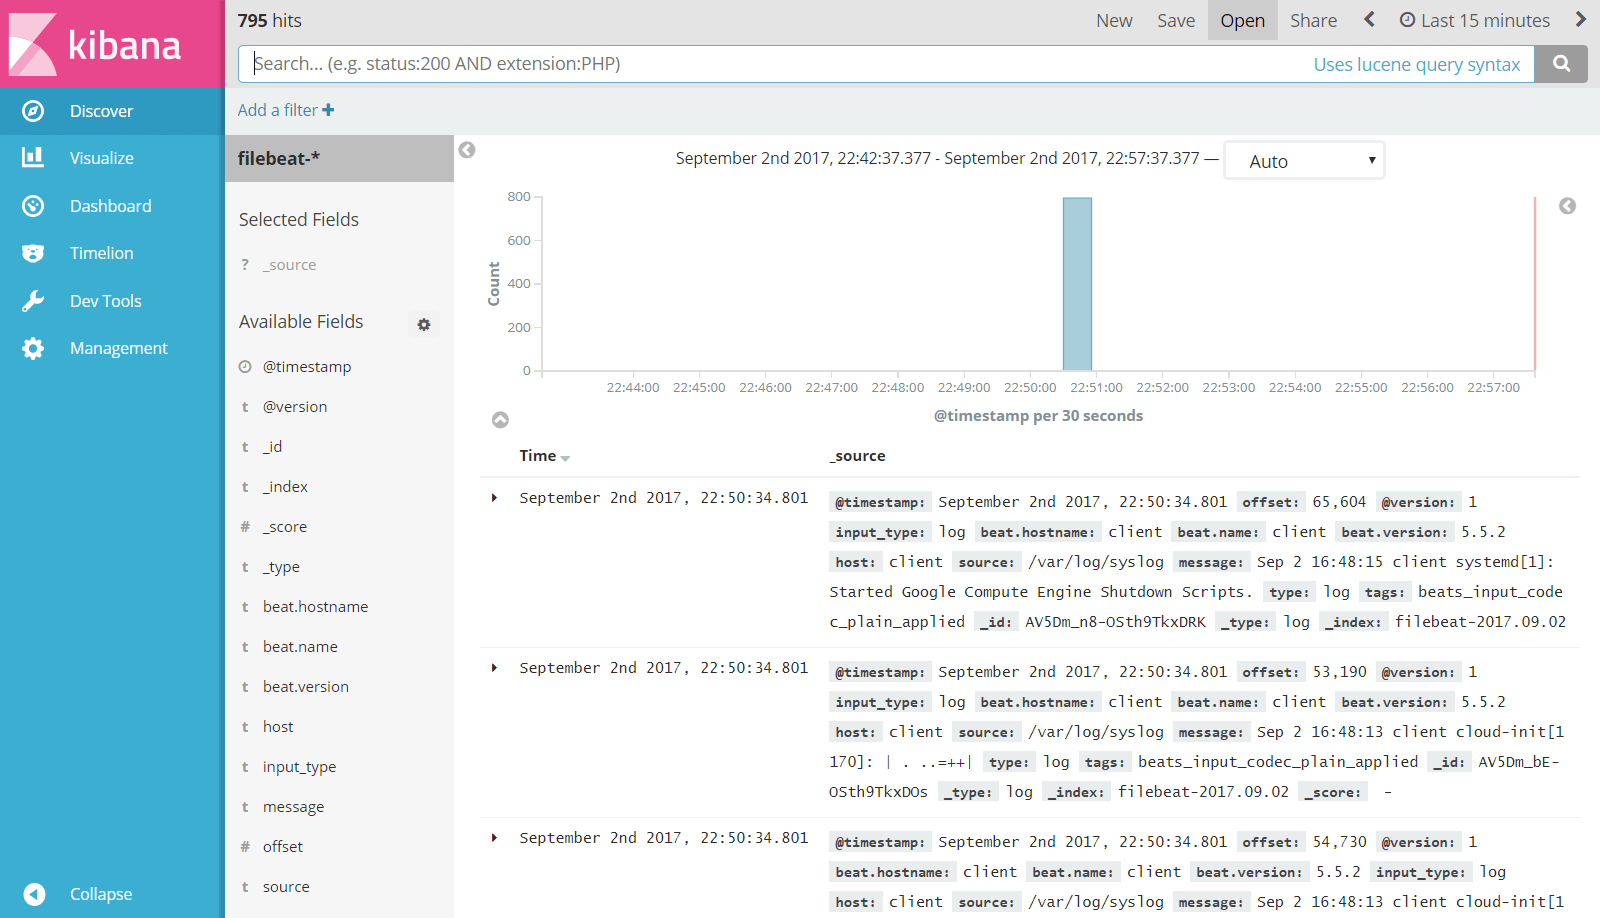
Click Discover in left navigation to view the incoming logs from client machine.
That’s All. You have successfully setup ELK stack on Ubuntu 16.04