After installing the Zabbix server and Zabbix agent, you are now due for adding a node to the Zabbix server for monitoring.
Install Zabbix Server:
READ: How To Install Zabbix Server 4.0 on CentOS 7 / RHEL 7
READ: How To Install Zabbix Server 4.0 on Ubuntu 18.04 / Ubuntu 16.04 & Debian 9
Install Zabbix Client:
READ: How To Install Zabbix Agent on CentOS 7/6, Ubuntu 18.04/16.04 & Debian 9/8
Add Host To Zabbix Monitoring
Login to Zabbix Web console using the admin account. Then, go to Configuration >> Hosts >> Create Host.
Enter the details for the following parameters.
Hostname: Hostname of the remote node
Visible name: Name of the remote node
Group: Select host groups the node belongs to.
Agent Interface: Enter IP Address or DNS name (IP Address is recommended)
Connect to: Choose IP / DNS (The way the communication happen between the server and the node. IP recommended)
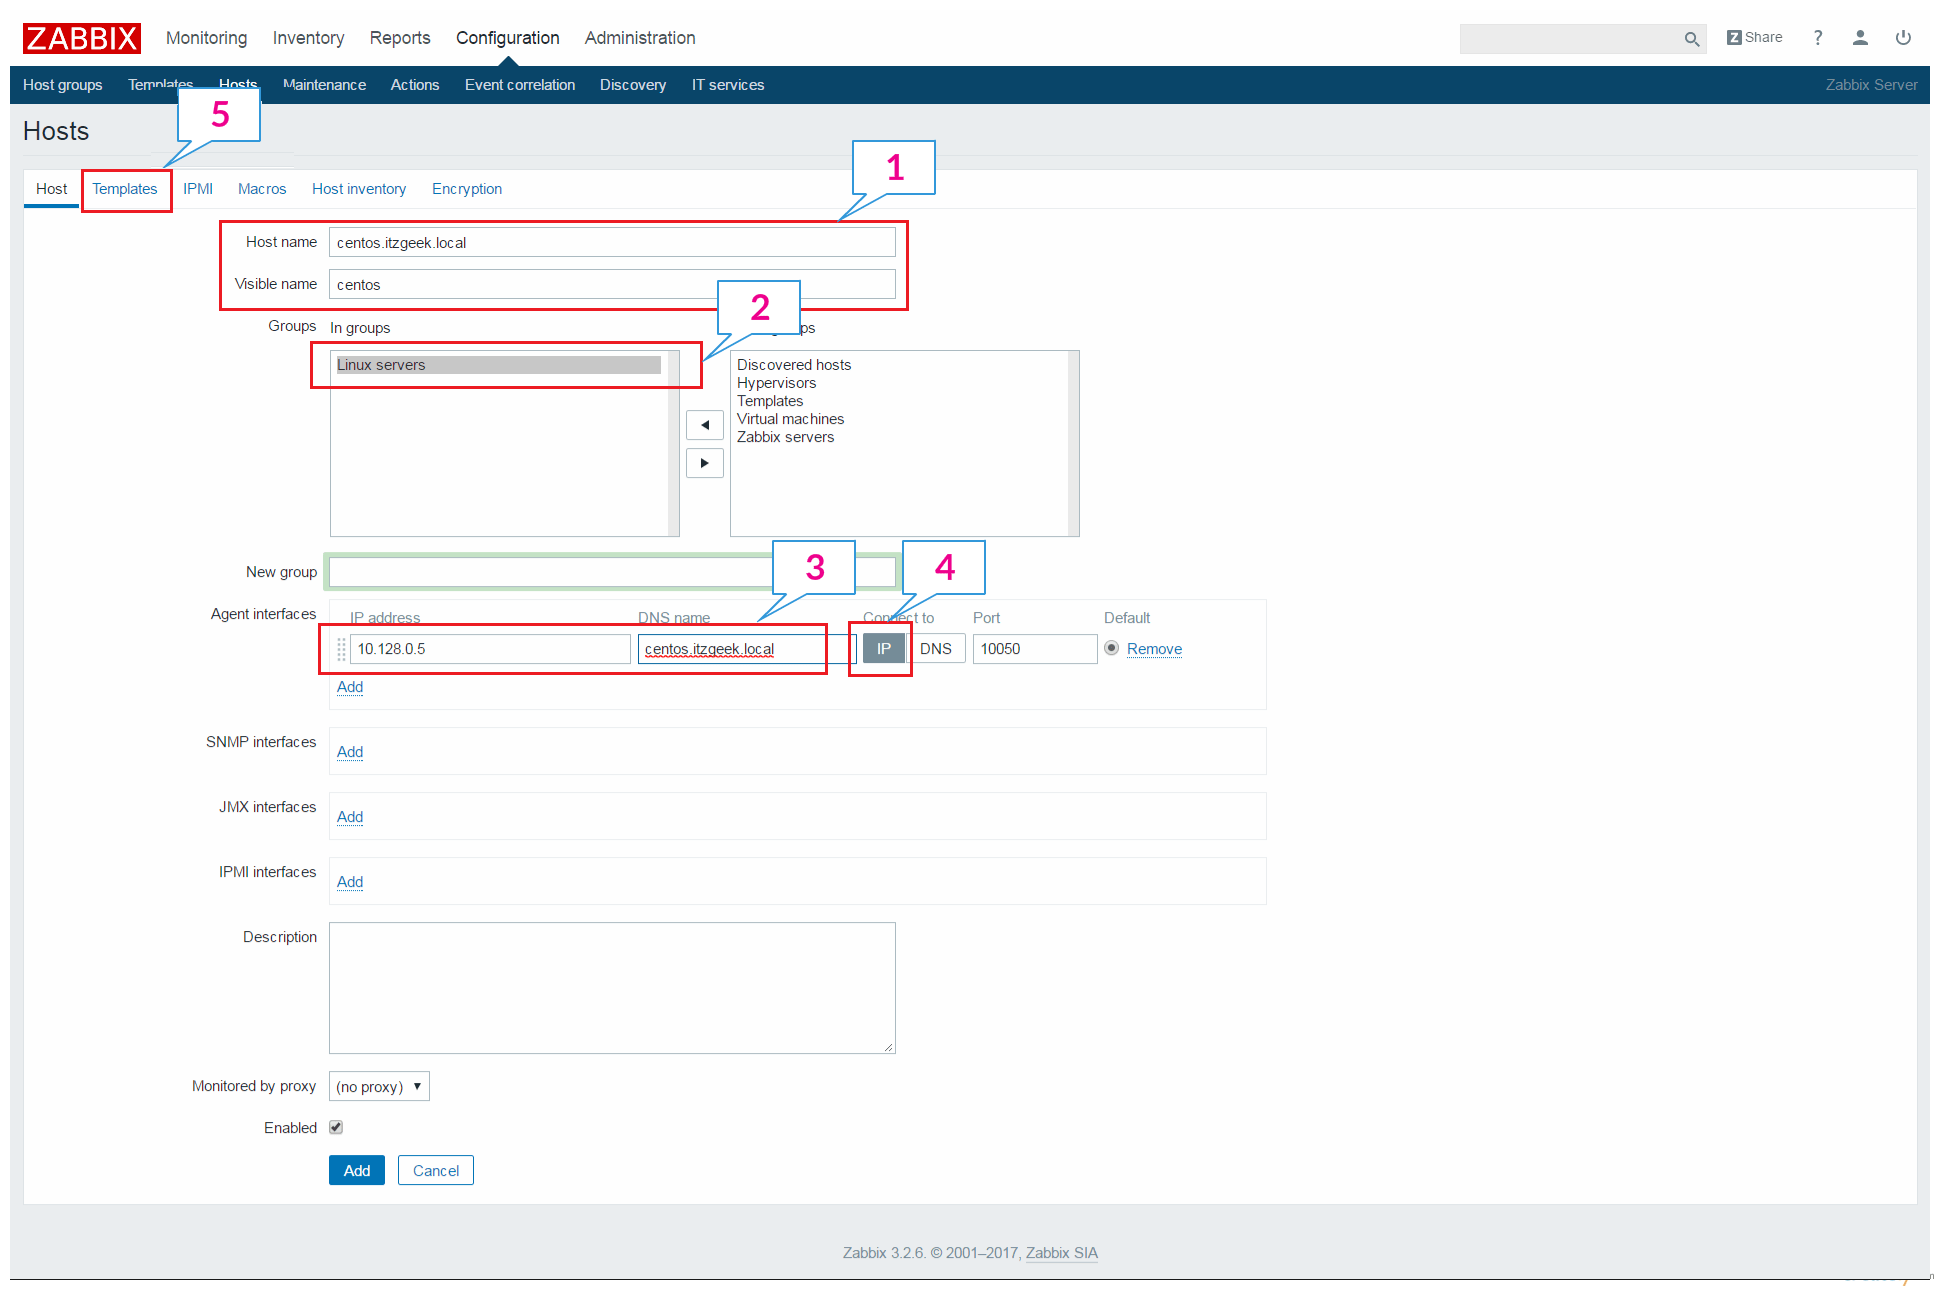
Don’t click on Add.
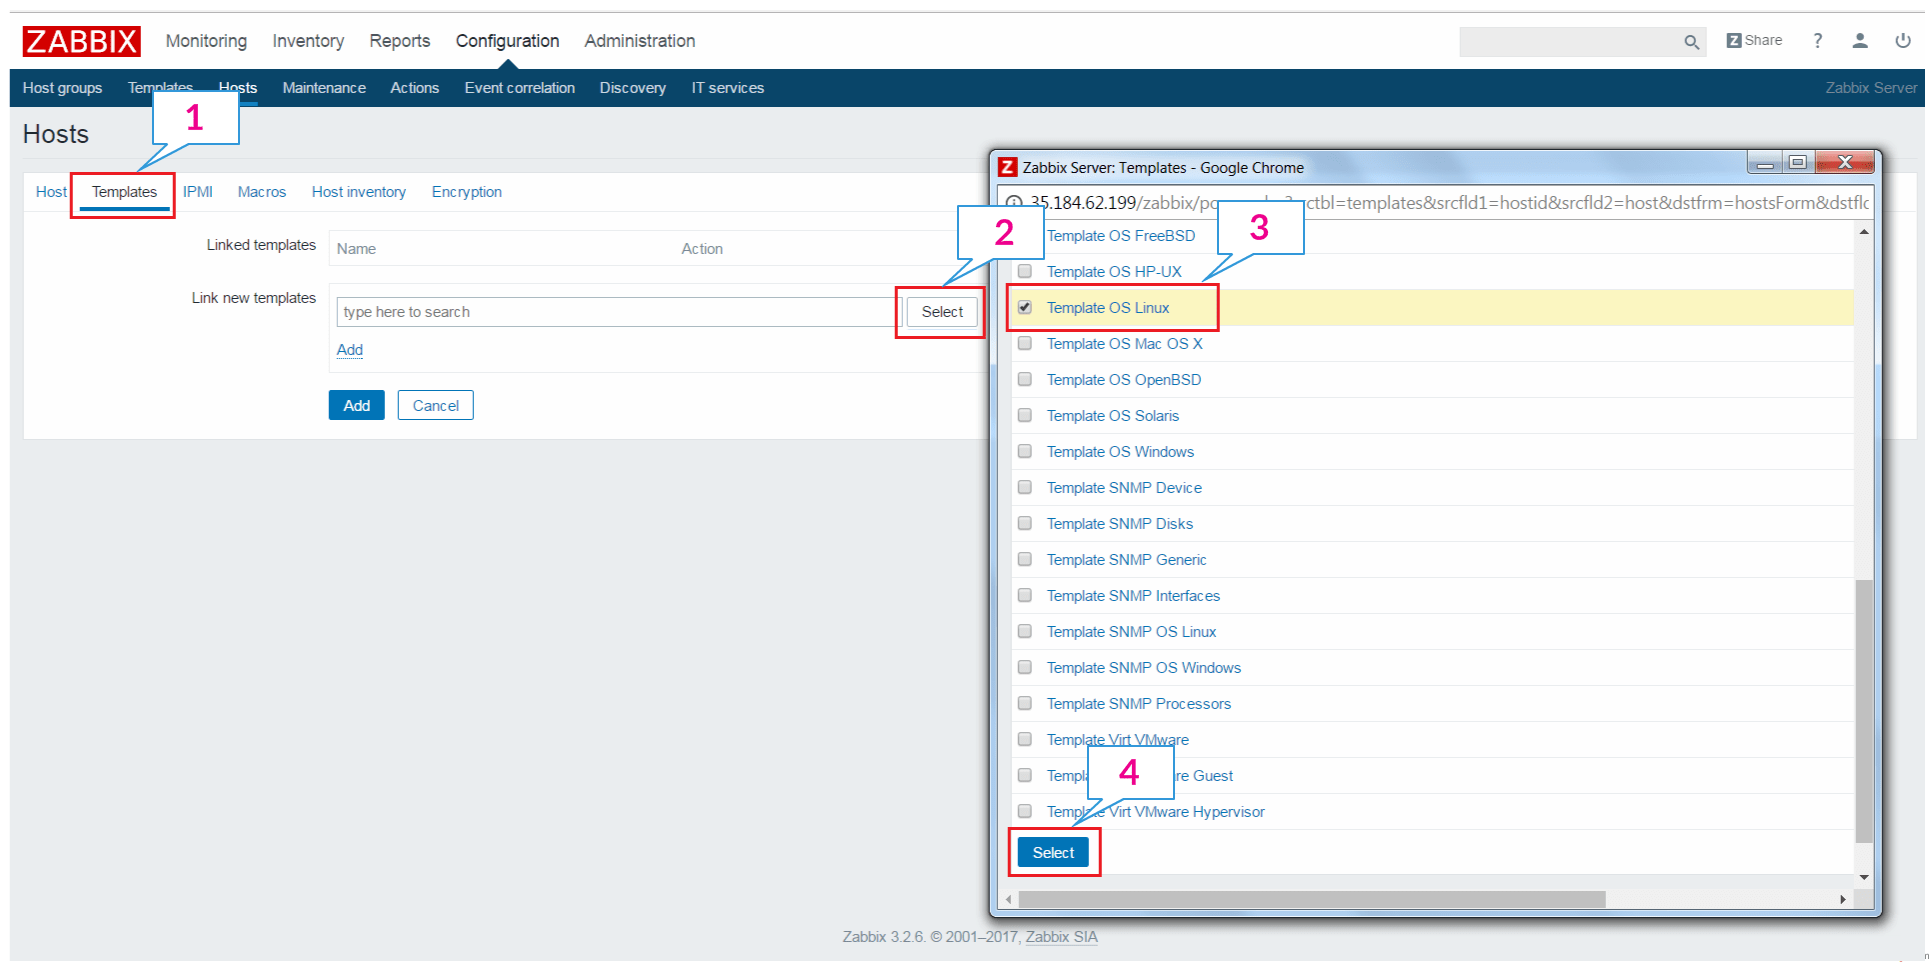
Attach Templates to Host
Zabbix has pre-defined templates that can be applied to multiple hosts. A template is a set of entities which reduces your manual effort in configuring triggers, items, graphs, application, etc. for each host.
For example, if you have created a template for monitoring the web server that has what parameters to monitor and when to trigger the alert, the same template can be attached to another server which functions similarly.
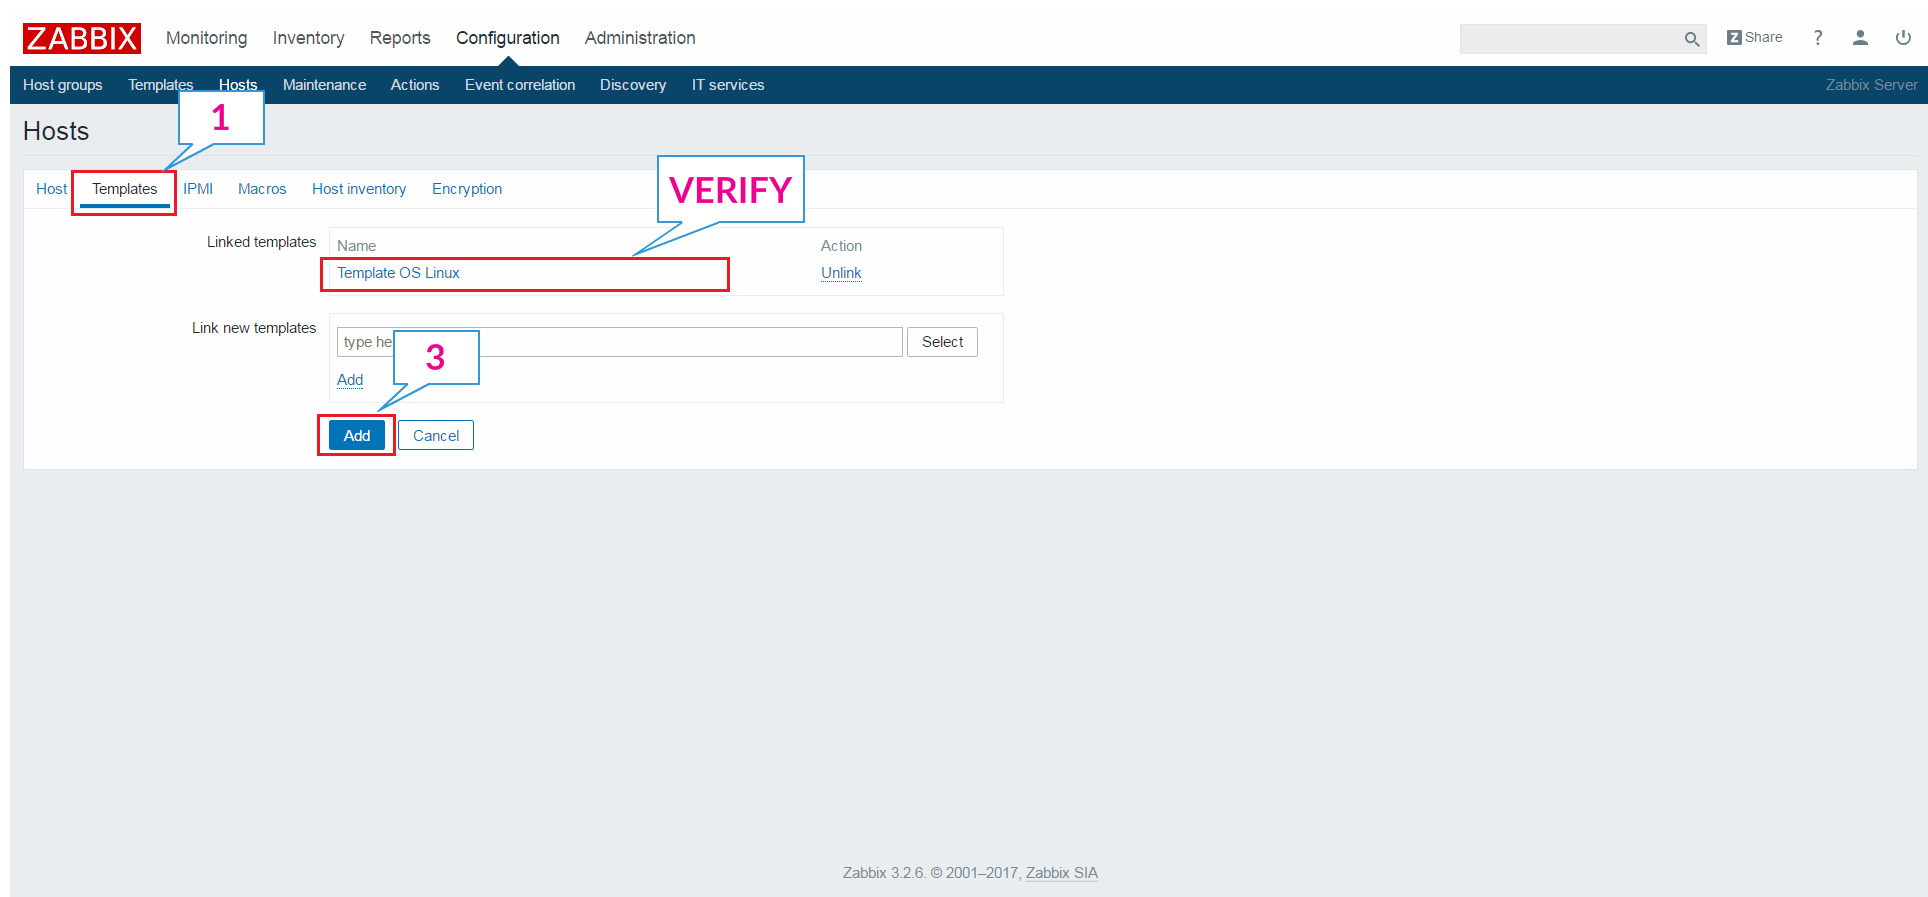
Go to Templates >> Link new templates. You either type to search a template or click on the Select to choose from a list of templates. Tick mark the template you want to link to the new host.
In my case,
Link new templates: Template OS Linux
Then, click on Add.

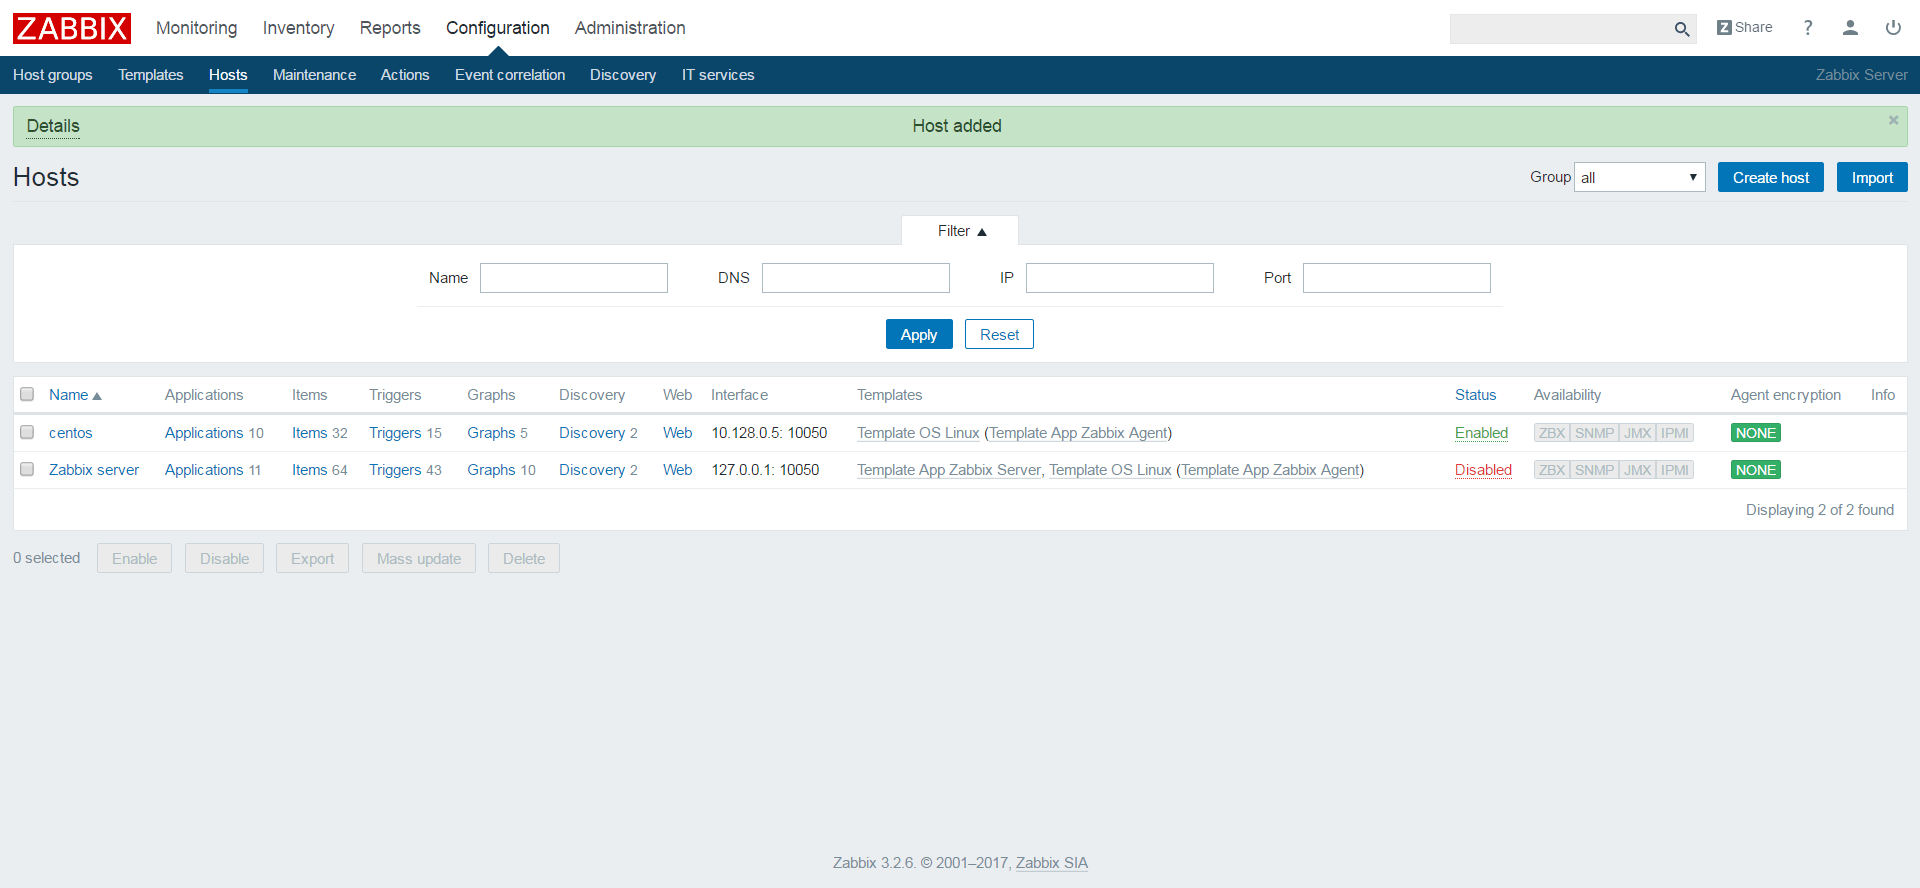
Finally, click on Add to complete the addition of the host.
Below is the list of hosts under the Zabbix monitoring tool. Go to Configuration >> Hosts.
Monitor host with Zabbix
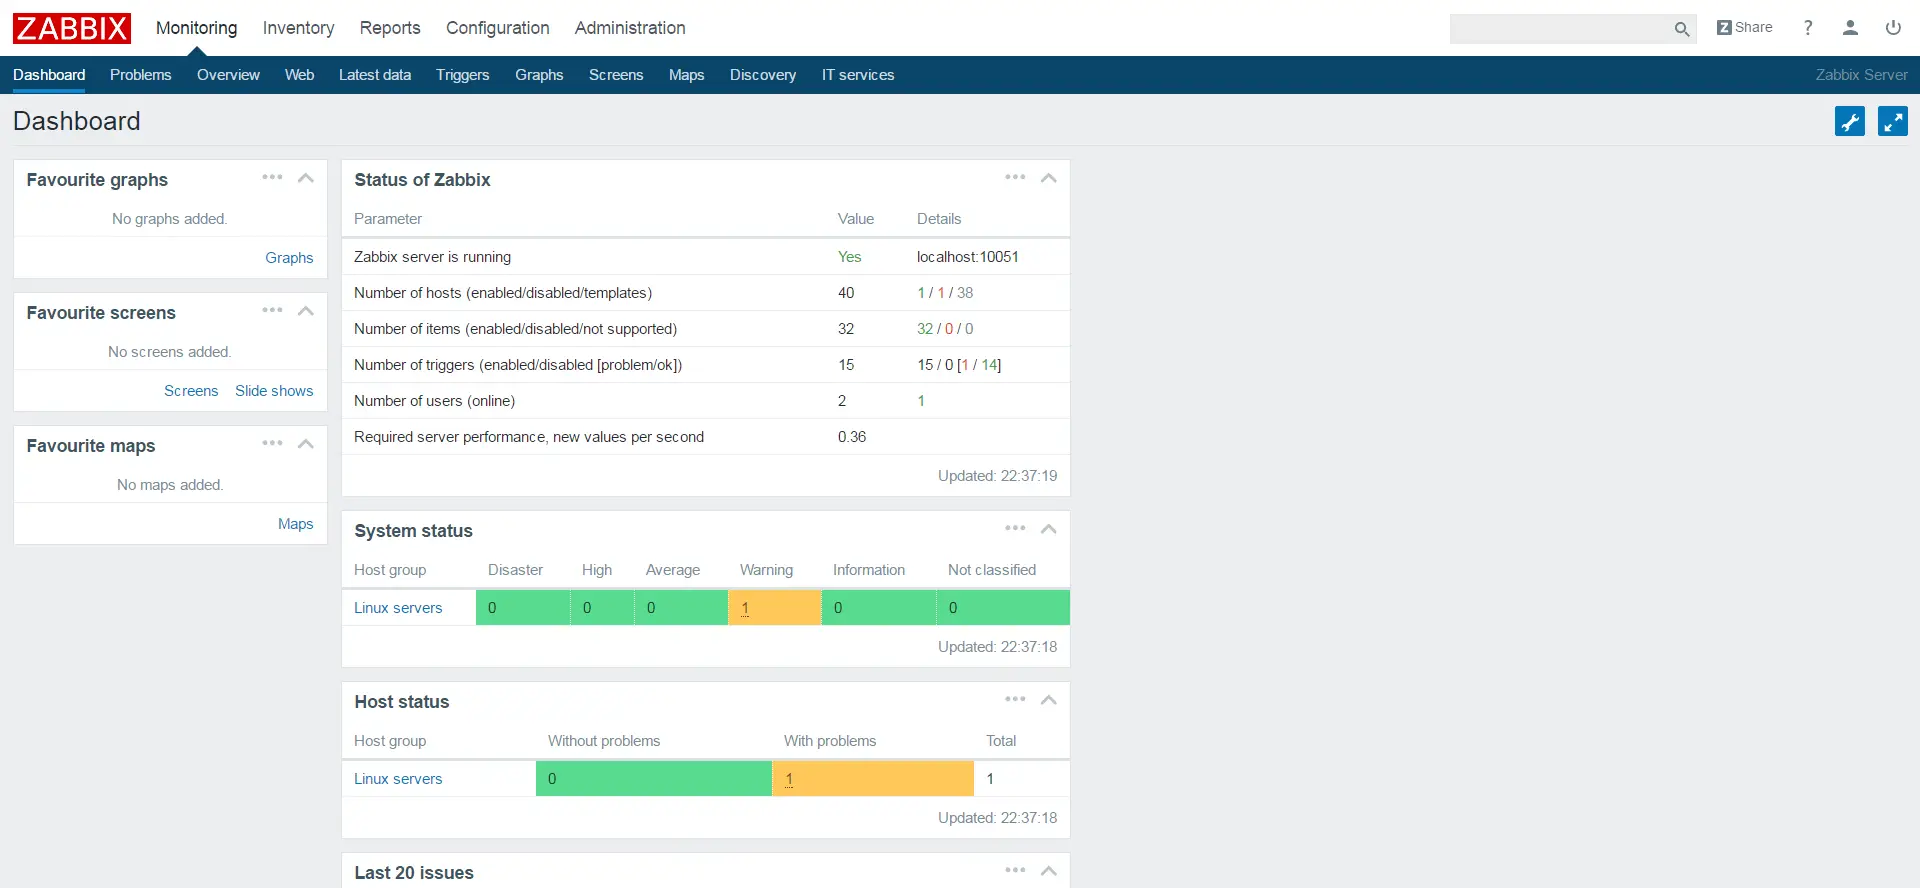
Once you have added a host to Zabbix server, you can monitor the host for any problem by going to Monitoring.
Dashboard: Overview of the whole infrastructure.
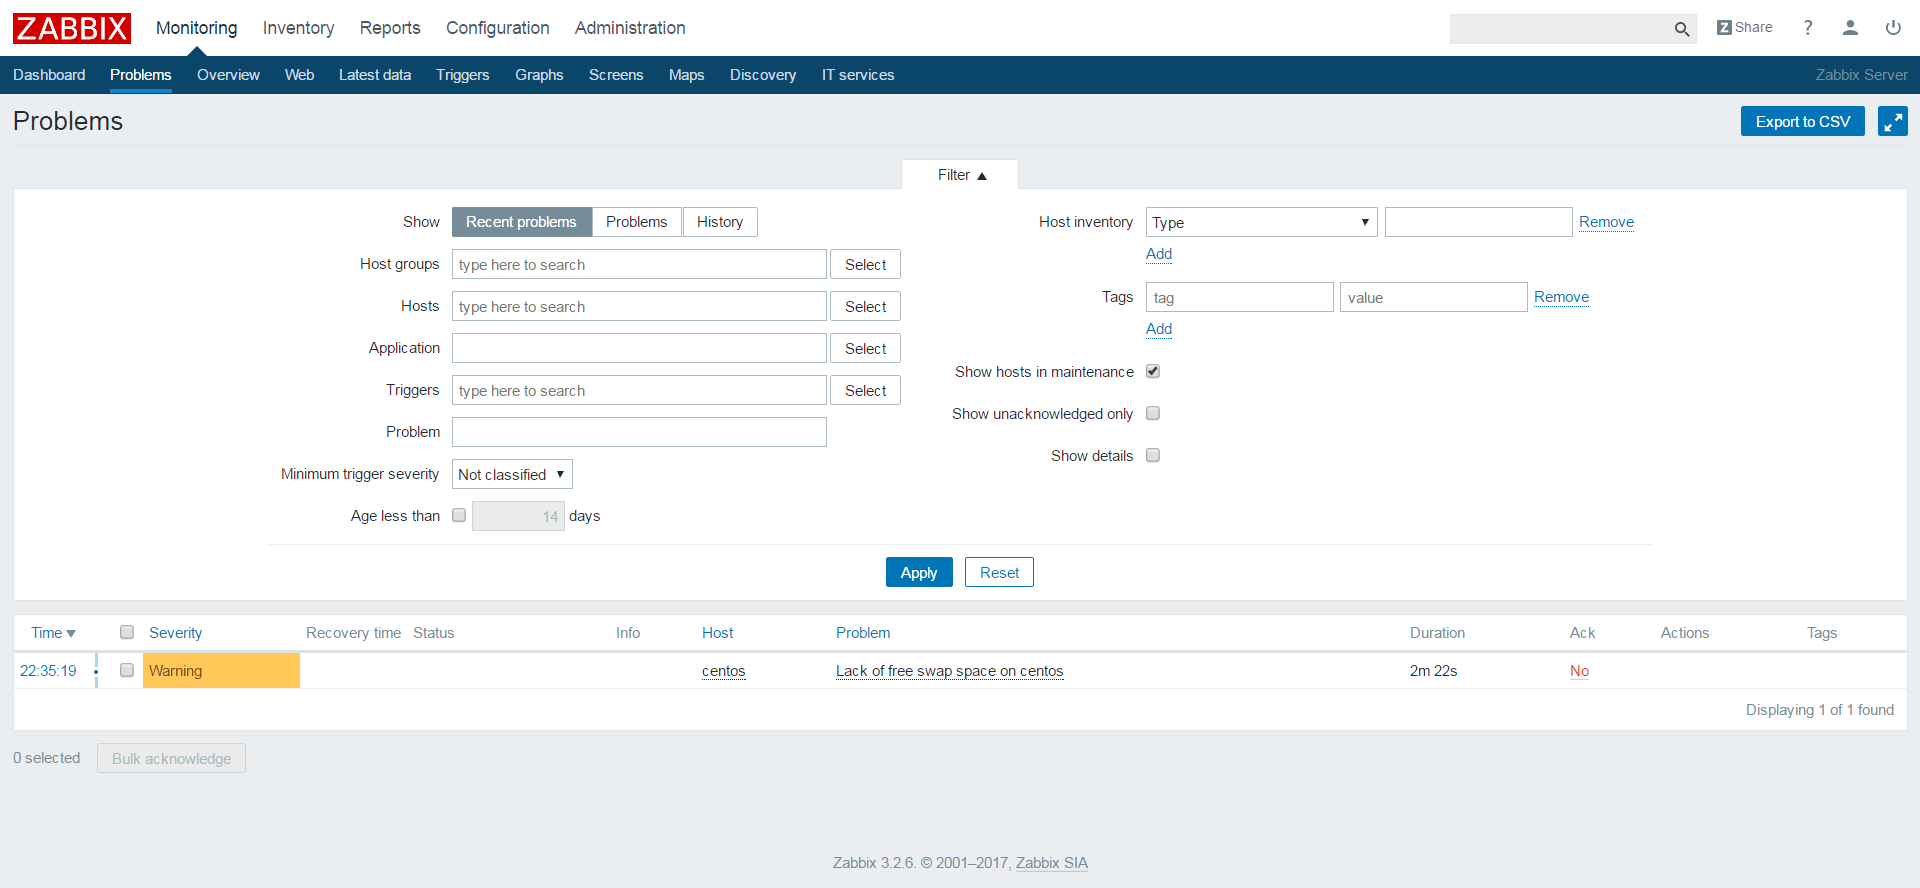
Problems: List of current issues and past history.
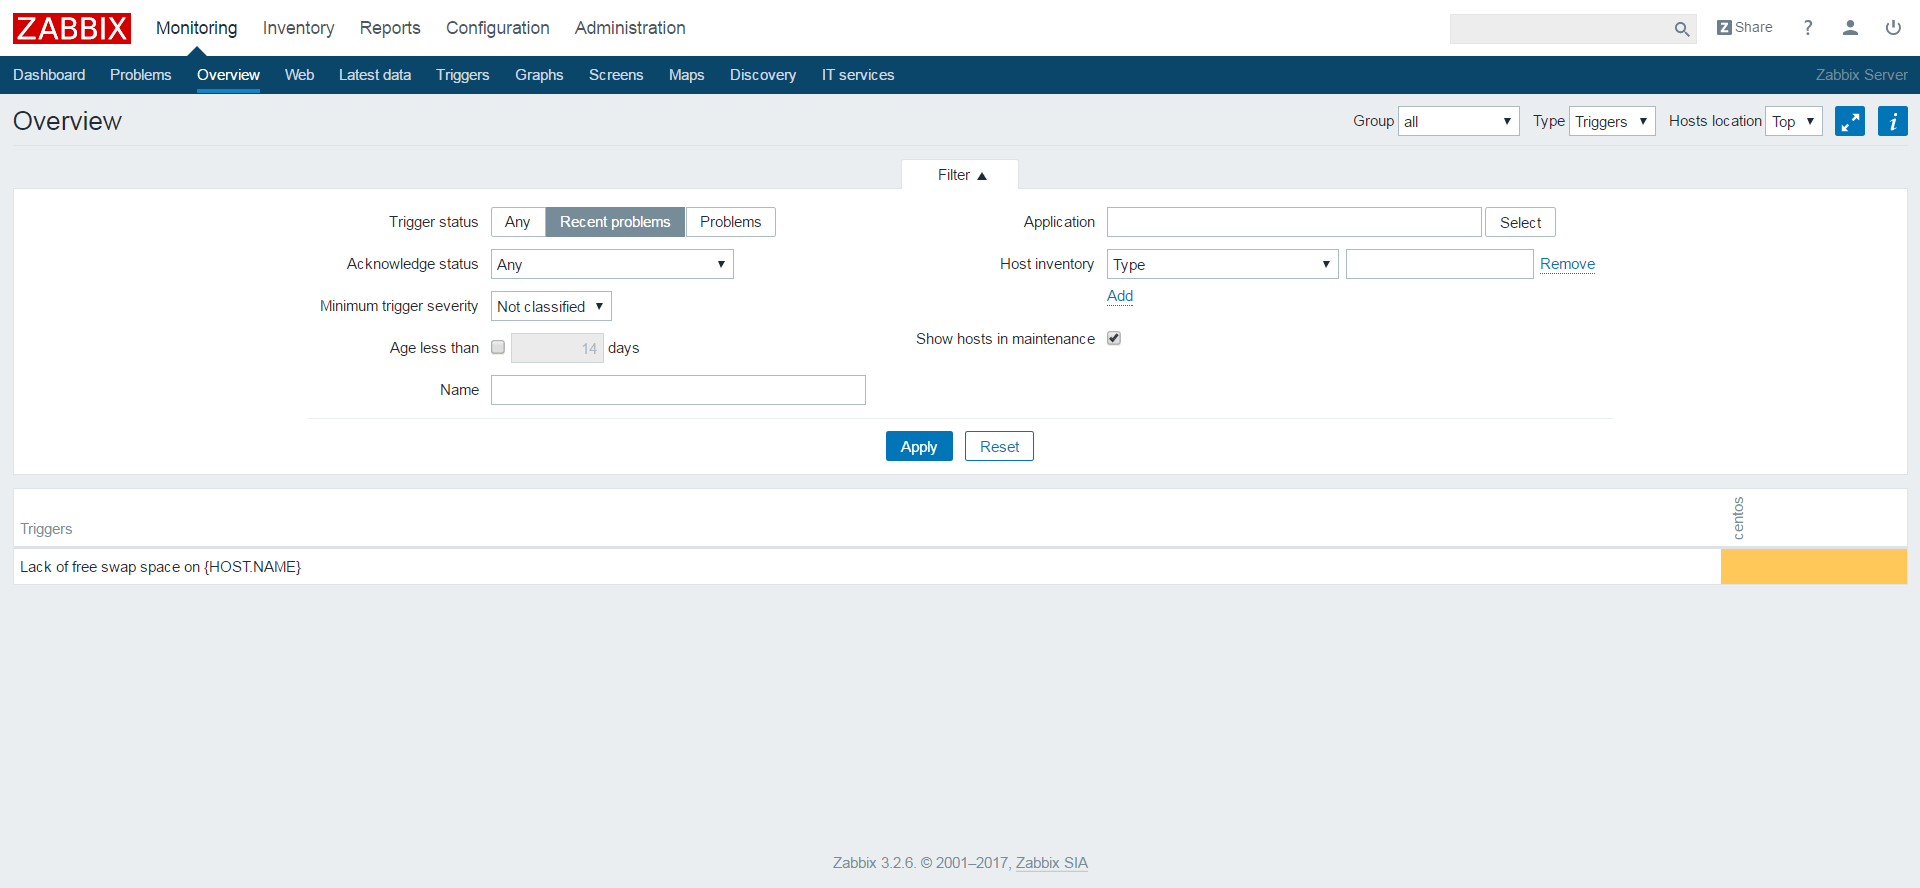
Overview: Lists the current issues.
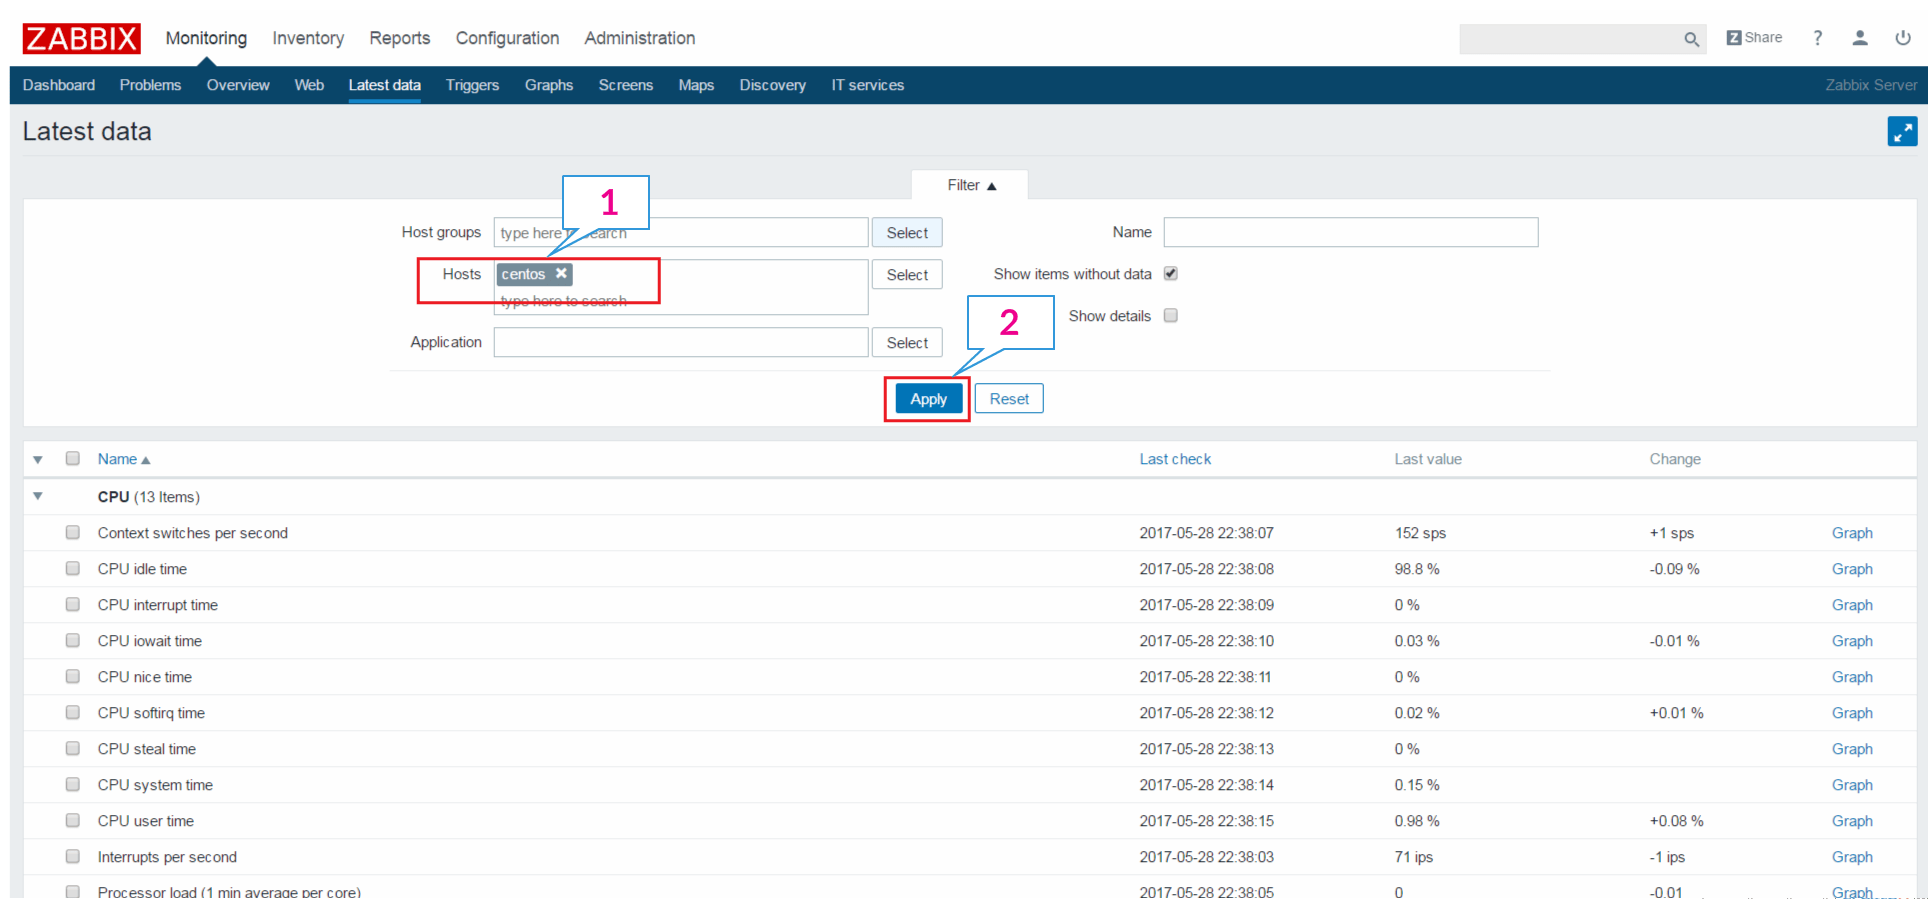
Latest data: Get the latest data (in values) of host groups/hosts / Applications.
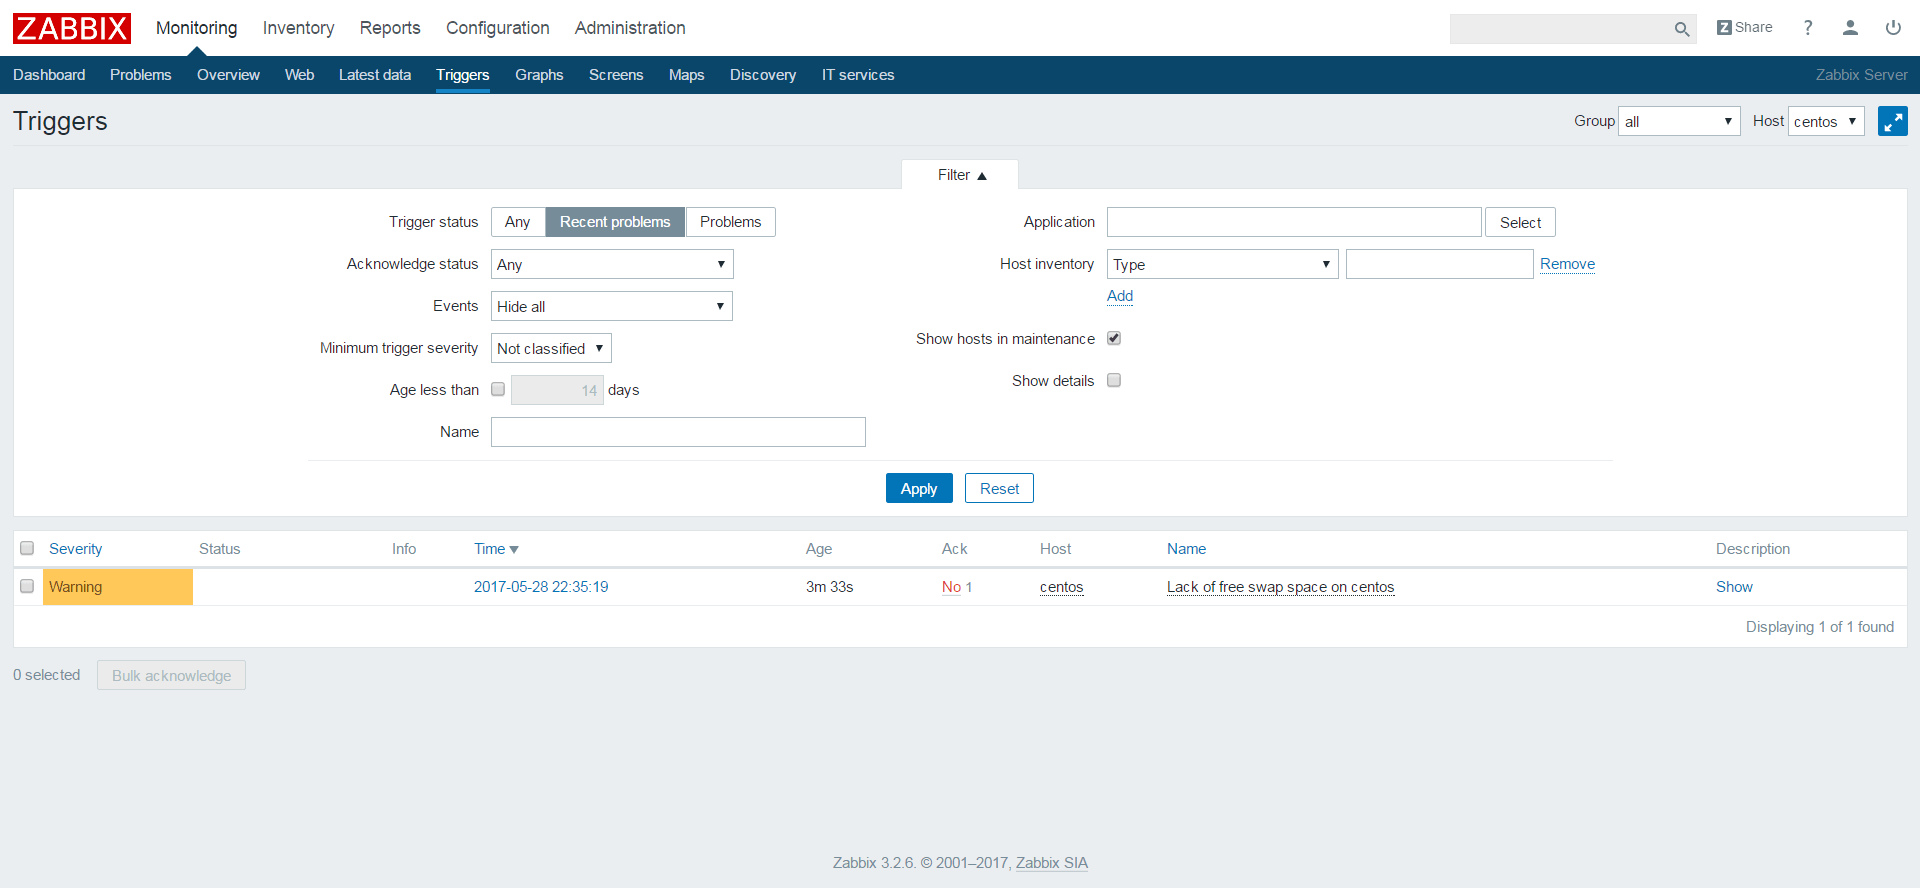
Triggers: Lists the current problems. Here, you can acknowledge the problem and close them after resolving it.
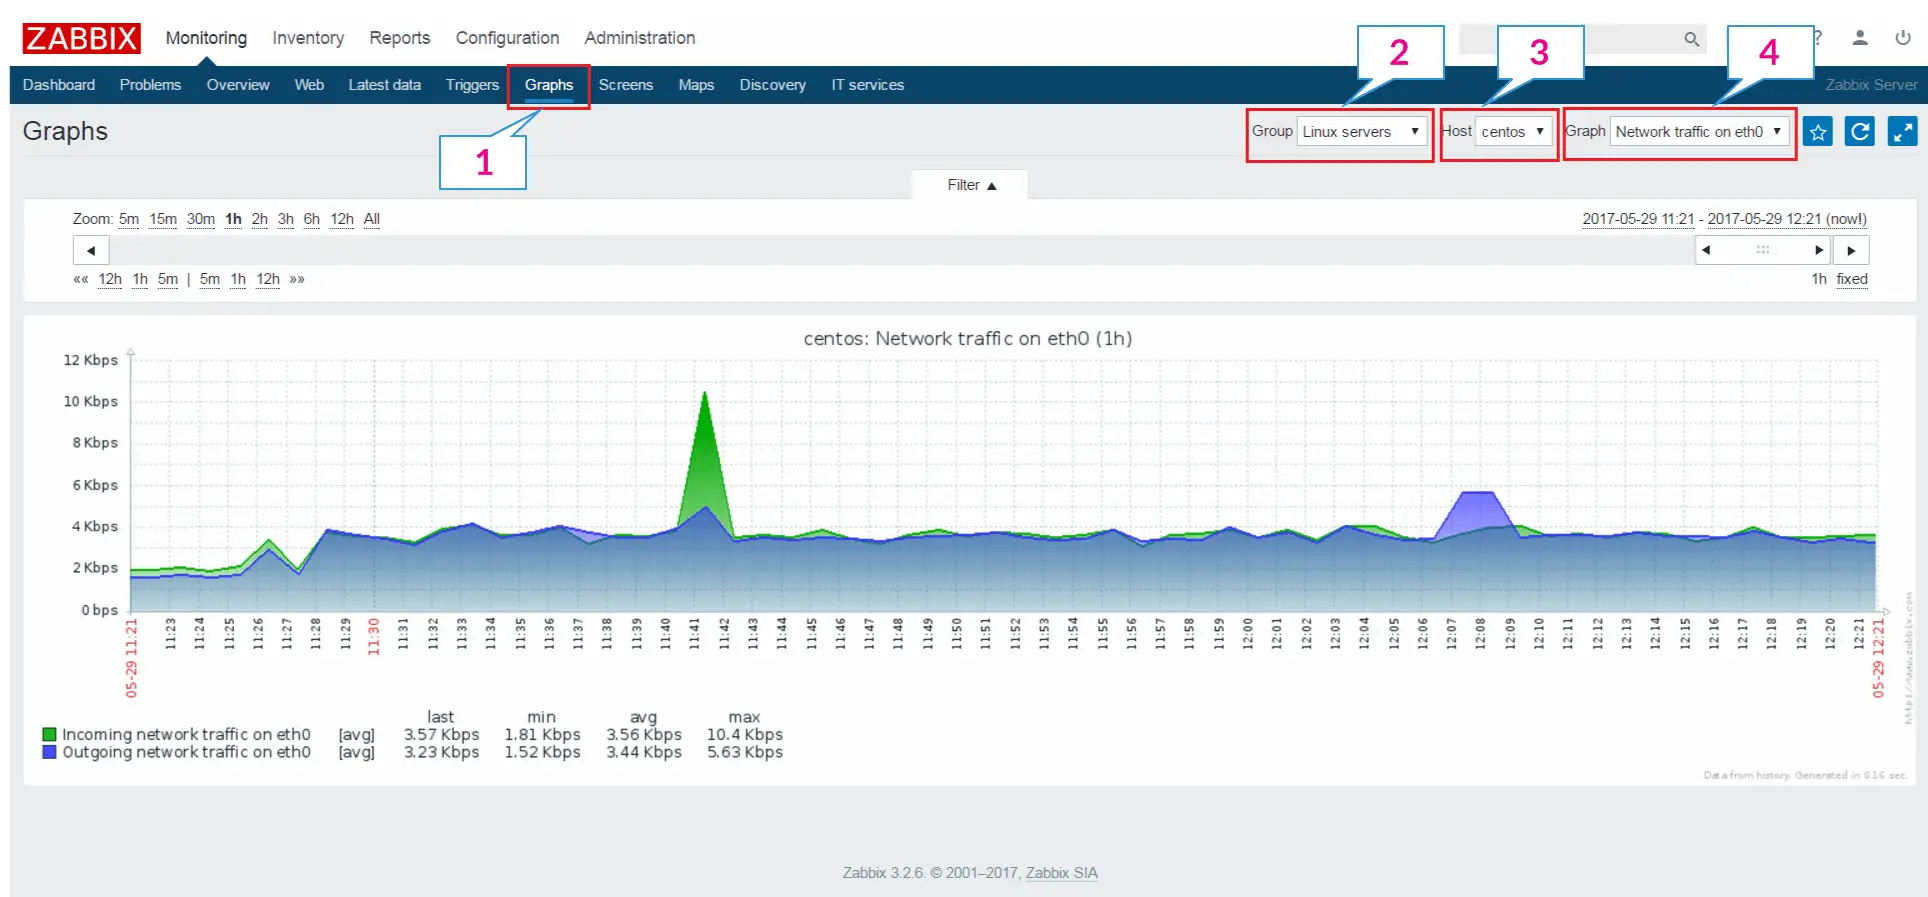
Graphs: Visualization of collected resource statistics such as CPU load, CPU utilization, Memory usage, etc.
Interested in Server Monitoring
READ: Install and Configure Nagios on CentOS 7 / Ubuntu 18.04 / Debian 9
READ: Install Icinga2 on Ubuntu 18.04 / Ubuntu 16.04 & Debian 9
READ: Netdata – Real-Time Performance Monitoring Tool for Linux
That’s All.