Once you installed the Icinga, you can monitor the system via web interface; by default it is limited to monitor the local machine where Icinga installed. If you like to monitor the remote Linux box or Windows box, you need to have Nagios plugin and NRPE add-on installed on the remote box. Once installed the plugin and add-on, you need to configure the Icinga server to collect the information from the remote machine and display it on the web interface.
If you are yet to install the Icinga; visit the post of Installing Icinga on Ubuntu 14.10, with icinga you can monitor remote services in two ways.
- Monitor public services,
- Monitor using NRPE add-on.
Monitoring public services:
Icinga supports monitoring public services like HTTP, POP3, IMAP, FTP, and SSH, since these services do not require special access requirements. Public services are meant that are accessible either over intra network or internet, these services are mostly used by us on daily basis.
With use of plugins, we can extend the monitoring possibilities to specific application and protocol of our requirement. In this tutorial, we will monitor both http and ssh service of web server. Lets begin with creating config file, all new config file should be created under /etc/icinga/objects.
You can replace file name (itzgeek.cfg) with file name of your choice, must end with .cfg.
$ sudo nano /etc/icinga/objects/itzgeek.cfg
Replace host_name and address according to your requirements, place your hostname and ip address in host_name and address fields respectively.
define host{
use                     generic-host            ; Name of host template to use
host_name               itzgeek.com
alias                   My Web Server
address                 23.229.xxx.xxx
}

define service {
host_name               itzgeek.com
service_description     HTTP
check_command           check_http
use                     generic-service
}

# check that ssh services are running
define service {
host_name               itzgeek.com
service_description     SSH
check_command           check_ssh
use                     generic-service
}
Once done, restart icinga service.
$ sudo service icinga restart
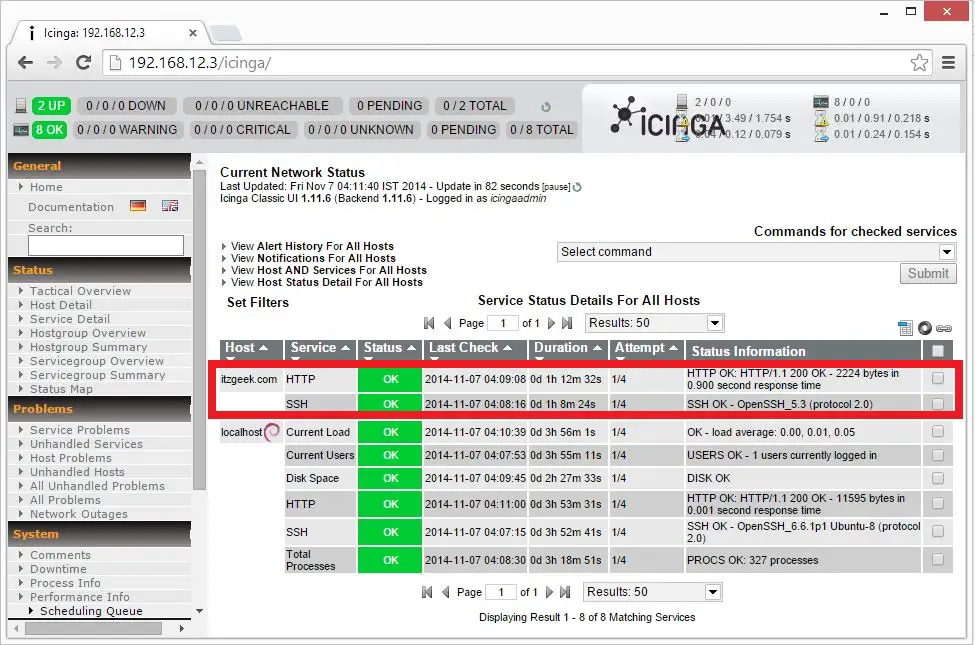
Check the service status in web interface, you should see newly added host in portal.
Monitor using NRPE add-on:
Icinga does not collect private statistics of remote host on its own, to over come this; remote host must have add-on installed. NRPE add-on will gather data and icinga server will collect from it. Todo that, we will install NRPE add-on on remote host and will configure icinga server to collect the data.
Update apt repositories.
$ sudo apt update
Install NRPE and nagios plugins.
$ sudo apt install nagios-plugins nagios-nrpe-server
Modify the /etc/nagios/nrpe.cfg on the remote host, it contains the command argument to check the service on the remote host. The nrpe.cfg file contains the basic commands to check the remote services, below are the command lines to check the cpu load and running process. The check_hda1 and check_total_procs has to be entered on template file on the server host to enable the monitoring.
command[check_hda1]=/usr/lib/nagios/plugins/check_disk -w 20% -c 10% -p /dev/hda1
command[check_total_procs]=/usr/lib/nagios/plugins/check_procs -w 150 -c 200
Note: While configuring check_hda1, modify it according to your remote host disk layout. In my case, need to monitor / mount point which is /dev/sda6; the following entry will have to set in /etc/nagios/nrpe.cfg on remote host.
command[check_sda6]=/usr/lib/nagios/plugins/check_disk -w 20% -c 10% -p /dev/sda6
In the above command -w stands for warning whereas -c stands for critical alert. For example if you execute the second command on the terminal, it will check the running process; it will warn when the process more than 150 or it will report critical when the process more than 200 and at the same time it will say OK if process below 150.
$ /usr/lib/nagios/plugins/check_procs -w 150 -c 200
PROCS OK: 17 processes | procs=17;150;200;0;
Change warning to 15 and critical to 150 for testing purpose, since process running on the server is very less. Now you can see the warning message, according to your requirement you can modify it.
$ /usr/lib/nagios/plugins/check_procs -w 15 -c 200
PROCS WARNING: 17 processes | procs=17;15;200;0;
Do not forget to check the following parameter in the file, this is to ensure that service running on correct port.
server_port=5666
If you have multiple network cards, configure this to make a service listen on particular network card.
server_address=192.168.12.9
Add icinga servers ip in allowed_hosts, if this parameter is set; only listed icinga servers can connect to this host.
allowed_hosts=192.168.12.6
Icinga server needs to be allowed to pass command line arguments, so set dont_blame_nrpe to 1.
dont_blame_nrpe=1
Once modified, restart NRPE server.
$ sudo /etc/init.d/nagios-nrpe-server restart
Confirm that NRPE Listening.
$ sudo netstat -antup | grep 5666
tcp        0      0 0.0.0.0:5666            0.0.0.0:*               LISTEN      7333/nrpe
tcp6       0      0 :::5666                 :::*                    LISTEN      7333/nrpe
Configure Icinga Server:
Now its the time configure the Icinga server to monitor the remote client, You’ll need to install nrpe-plugin.
$ sudo apt-get install nagios-nrpe-plugin
Verify the remote host NRPE server version.
$ sudo /usr/lib/nagios/plugins/check_nrpe -H 192.168.12.9
NRPE v2.15
Create the new configuration file (/usr/local/icinga/etc/objects/remote.cfg) to define the host and service definition.
sudo nano /etc/icinga/objects/remote.cfg
You can use the following template, modify according to your requirement, the following is configured to display the CPU Load,Disk Space,Current Users.
define host{
use                   generic-host
host_name             remote.itzgeek.com
alias                 My Remote Ubuntu Server
address               192.168.12.9
}
define service{
use generic-service
host_name              remote.itzgeek.com
service_description    Root Partition
check_command          check_nrpe_1arg!check_sda6
}
define service{
use                    generic-service
host_name              remote.itzgeek.com
service_description    Current Users
check_command          check_nrpe_1arg!check_users
}
define service{
use                    generic-service
host_name              remote.itzgeek.com
service_description    Total Processes
check_command          check_nrpe_1arg!check_total_procs
}
define service{
use                    generic-service
host_name              remote.itzgeek.com
service_description    Current Load
check_command          check_nrpe_1arg!check_load
}
Restart the icinga server.
$ sudo /etc/init.d/icinga restart
Monitor the remote machine:
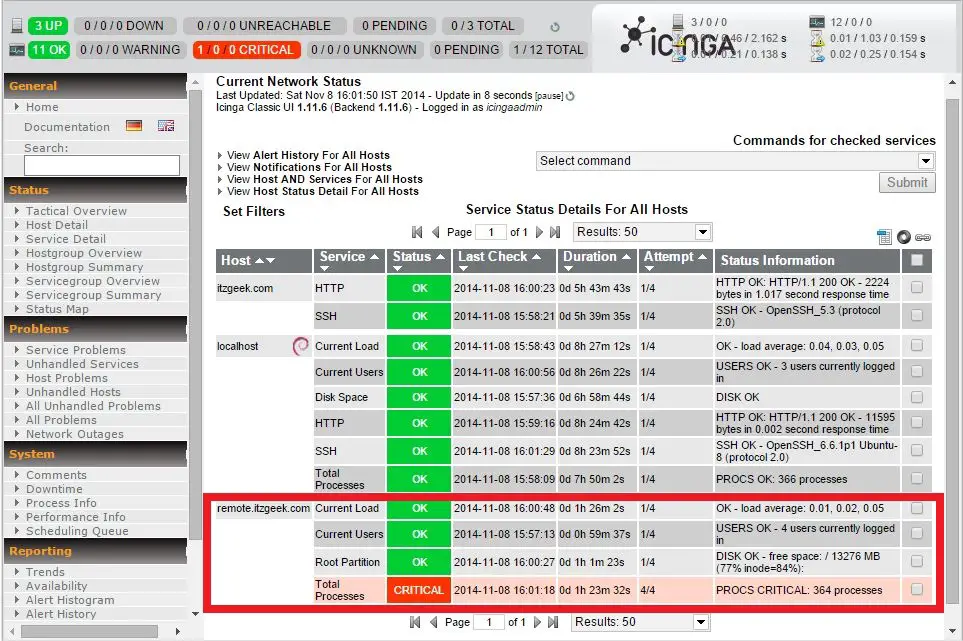
Now login to the web interface and start do the monitoring. The following screenshot shows the remote Linux server with the default service available.
That’s All. Now you can easily monitor the remote machine with Icinga.