In our last article, we set up Cacti for monitoring servers and network devices to draw the graph metrics such as CPU load and network bandwidth utilization.
This guide focus on how to monitor remote Linux servers with Cacti monitoring tool.
Prerequisites
Follow one of the links to setup Cacti monitoring tool based on your server operating system.
READ: How to Install Cacti on CentOS 7 / RHEL 7 & Fedora 27 / Fedora 26
READ: How to Install Cacti on Ubuntu 18.04 LTS
READ: How to Install Cacti on Ubuntu 16.04 / Ubuntu 14.04 & LinuxMint 18
READ: How to Install Cacti on CentOS 6 / RHEL 6
READ: How to Install Cacti on Debian 9 Stretch
Here, we will setup SNMP on the client servers (Linux machines), and then will configure Cacti to collect data from remote Linux machine via SNMP protocol.
Log in as the root user or switch to the root user.
sudo su -
OR
su -
Install SNMP
Use the YUM command on CentOS / RHEL and apt command on Debian / Ubuntu to install SNMP package.
### CentOS 7/6 , RHEL 7/6 & Fedora 27/26 ###
yum -y install net-snmp net-snmp-utils
### Debian 9/8 & Ubuntu 16.04/14.04 ###
apt-get update
apt-get -y install snmpd
Configure SNMP
Edit the SNMP configuration file.
### CentOS 7/6 , RHEL 7/6 & Fedora 27/26 ###
vi /etc/snmp/snmpd.conf
### Debian 9/8 & Ubuntu 16.04/14.04 ###
nano /etc/snmp/snmpd.conf
Update the snmpd.conf with the below details.
Below is the minimal SNMP configuration for Cacti. If you have a custom SNMP configuration present on the client server, then just update the below lines with existing configurations.
# Listen to all interface

agentAddress udp:161

# Change "myCactiCom" to your preferred SNMP community string

# Map "myCactiCom" community to the "CactiU" sec.name

# Change 192.168.1.0/24 depends on your network

com2sec CactiU 192.168.1.0/24 myCactiCom

# Map "CactiU" sec.name to group "myCactiGroup" for SNMP Version 2c

group myCactiGroup v2c CactiU

# Define 'AllView', which includes everything under .1

view all included .1

# Permission given to group "myCactiGroup" to access objects in the View

access myCactiGroup "" any noauth exact all none none
Restart SNMP service.
### SystemD – CentOS 7 / RHEL 7 / Ubuntu 16.04 / Debian 9 / Fedora 27/26 ###
systemctl restart snmpd
### Debian 8 / Ubuntu 14.04 / CentOS 6 / RHEL 6 ###
service snmpd restart
Enable SNMP service on system boot.
### SystemD – CentOS 7 / RHEL 7 / Ubuntu 16.04 / Debian 9 / Fedora 27/26 ###
systemctl enable snmpd
### SysInit – Debian 8 / Ubuntu 14.04 ###
update-rc.d snmpd defaults
### CentOS 6 / RHEL 6 ###
chkconfig snmpd on
Ensure SNMP process listens on all network interface or on a particular interface which is accessible to Cacti.
netstat -antup | grep -i 161
Output:
udp 0 0 0.0.0.0:161 0.0.0.0:* 25268/snmpd
Firewall
Configure the firewall to allow Cacti to fetch the data from client machines.
FirewallD:
firewall-cmd --permanent --add-port=161/udp
firewall-cmd --reload
IPTables:
iptables -A INPUT -p udp -m tcp --dport 161 -j ACCEPT
service iptables save
UFW:
ufw allow 161/udp
ufw reload
Test SNMP
On Cacti server, run the following command to see whether you are getting data from the client machine over SNMP.
snmpwalk -c myCactiCom 192.168.1.40 -v2c
Output:
SNMPv2-MIB::sysDescr.0 = STRING: Linux desktop 4.10.0-28-generic #32~16.04.2-Ubuntu SMP Thu Jul 20 10:19:48 UTC 2017 x86_64
SNMPv2-MIB::sysObjectID.0 = OID: NET-SNMP-MIB::netSnmpAgentOIDs.10
DISMAN-EVENT-MIB::sysUpTimeInstance = Timeticks: (3515) 0:00:35.15
SNMPv2-MIB::sysContact.0 = STRING: Me <[email protected]>
SNMPv2-MIB::sysName.0 = STRING: desktop
SNMPv2-MIB::sysLocation.0 = STRING: Sitting on the Dock of the Bay
SNMPv2-MIB::sysServices.0 = INTEGER: 72
SNMPv2-MIB::sysORLastChange.0 = Timeticks: (1) 0:00:00.01
SNMPv2-MIB::sysORID.1 = OID: SNMP-MPD-MIB::snmpMPDCompliance
SNMPv2-MIB::sysORID.2 = OID: SNMP-USER-BASED-SM-MIB::usmMIBCompliance
SNMPv2-MIB::sysORID.3 = OID: SNMP-FRAMEWORK-MIB::snmpFrameworkMIBCompliance
SNMPv2-MIB::sysORID.4 = OID: SNMPv2-MIB::snmpMIB
SNMPv2-MIB::sysORID.5 = OID: SNMP-VIEW-BASED-ACM-MIB::vacmBasicGroup
SNMPv2-MIB::sysORID.6 = OID: TCP-MIB::tcpMIB
SNMPv2-MIB::sysORID.7 = OID: IP-MIB::ip

.    .    .
.    .    .

NOTIFICATION-LOG-MIB::nlmLogVariableValueType."default".1.1 = INTEGER: timeTicks(3)
NOTIFICATION-LOG-MIB::nlmLogVariableValueType."default".1.2 = INTEGER: ipAddress(5)
NOTIFICATION-LOG-MIB::nlmLogVariableValueType."default".1.3 = INTEGER: objectId(7)
NOTIFICATION-LOG-MIB::nlmLogVariableTimeTicksVal."default".1.1 = Timeticks: (1) 0:00:00.01
NOTIFICATION-LOG-MIB::nlmLogVariableIpAddressVal."default".1.2 = IpAddress: 192.168.1.40
NOTIFICATION-LOG-MIB::nlmLogVariableOidVal."default".1.3 = OID: NET-SNMP-MIB::netSnmpAgentOIDs.10
Monitor Remote Linux Servers with Cacti
Log in into Cacti monitoring tool.
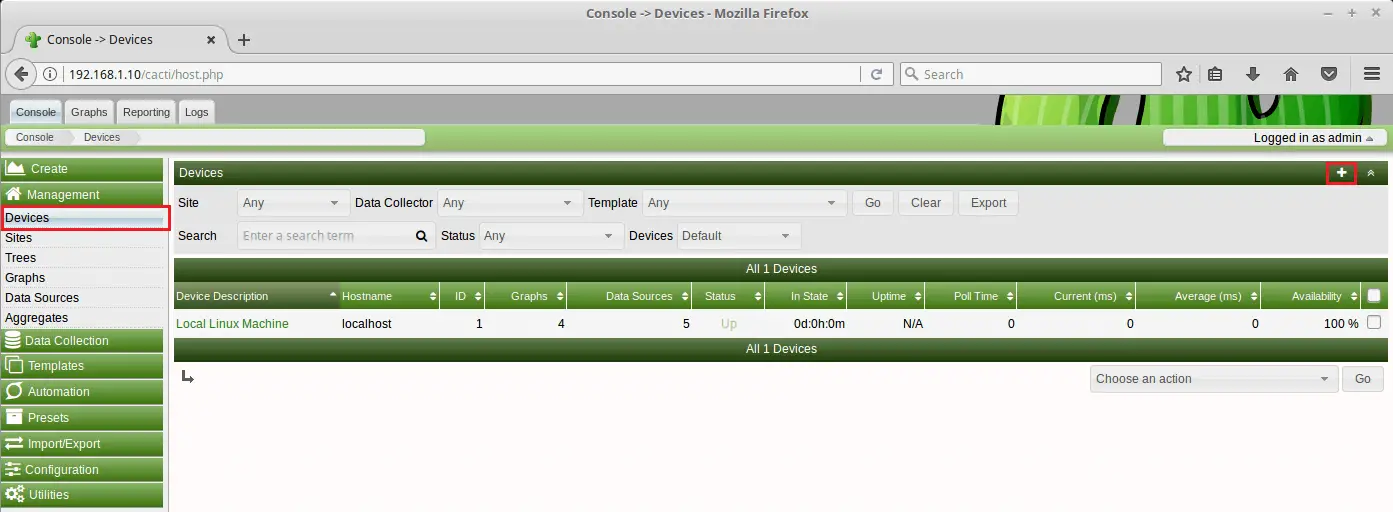
Add Linux Machines to Cacti
To add any device, go to Managment >> Device >> + Sign.
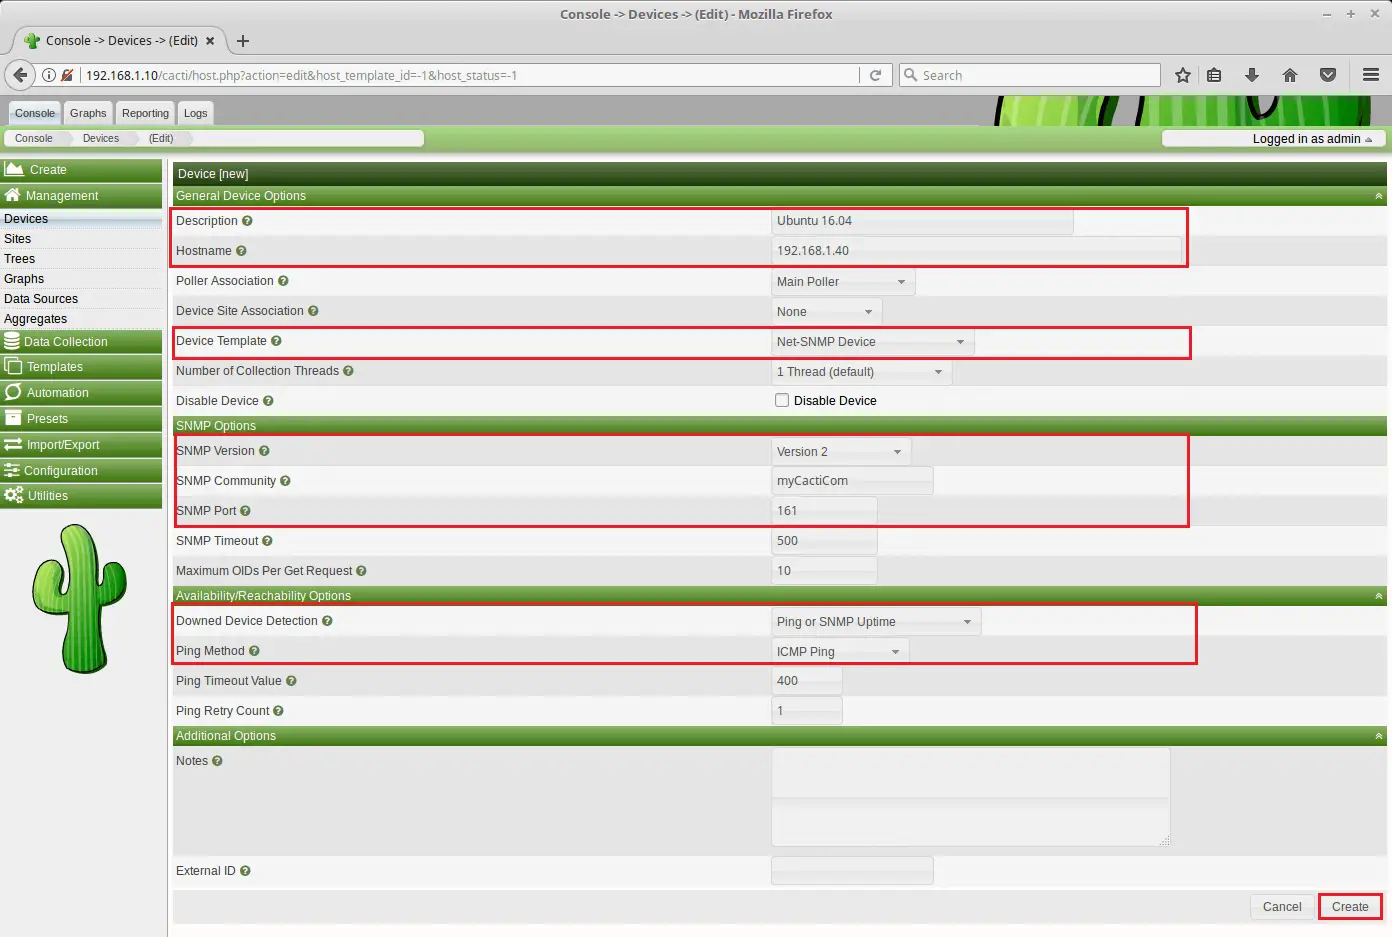
Use the details,
General Device Options:
Description: Ubuntu 16.04
Hostname: client.itzgeek.local OR 192.168.1.40
Host Template: Net-SNMP Device
SNMP Version: Version 2
SNMP Community: myCactiCom
Availability/Reachability Options:
Downed Device Detection: Ping or SNMP Uptime
Ping Method: ICMP Ping
Leave the others as it is.
Finally, click Create to create a device.
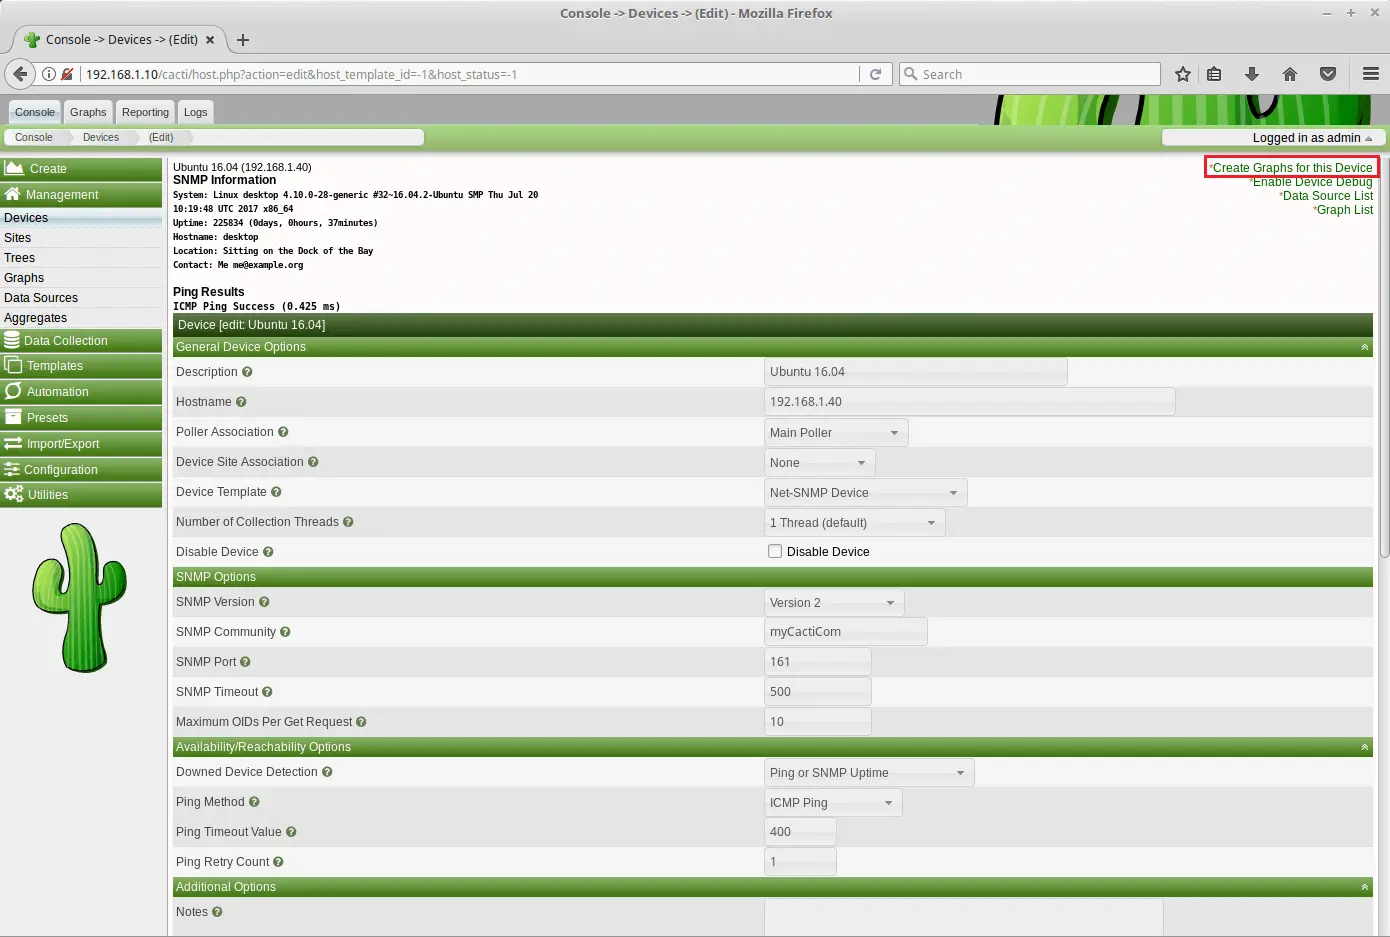
Once the device is added, click on “Create Graphs for this Host” link at the top right on the same page to create graphs.
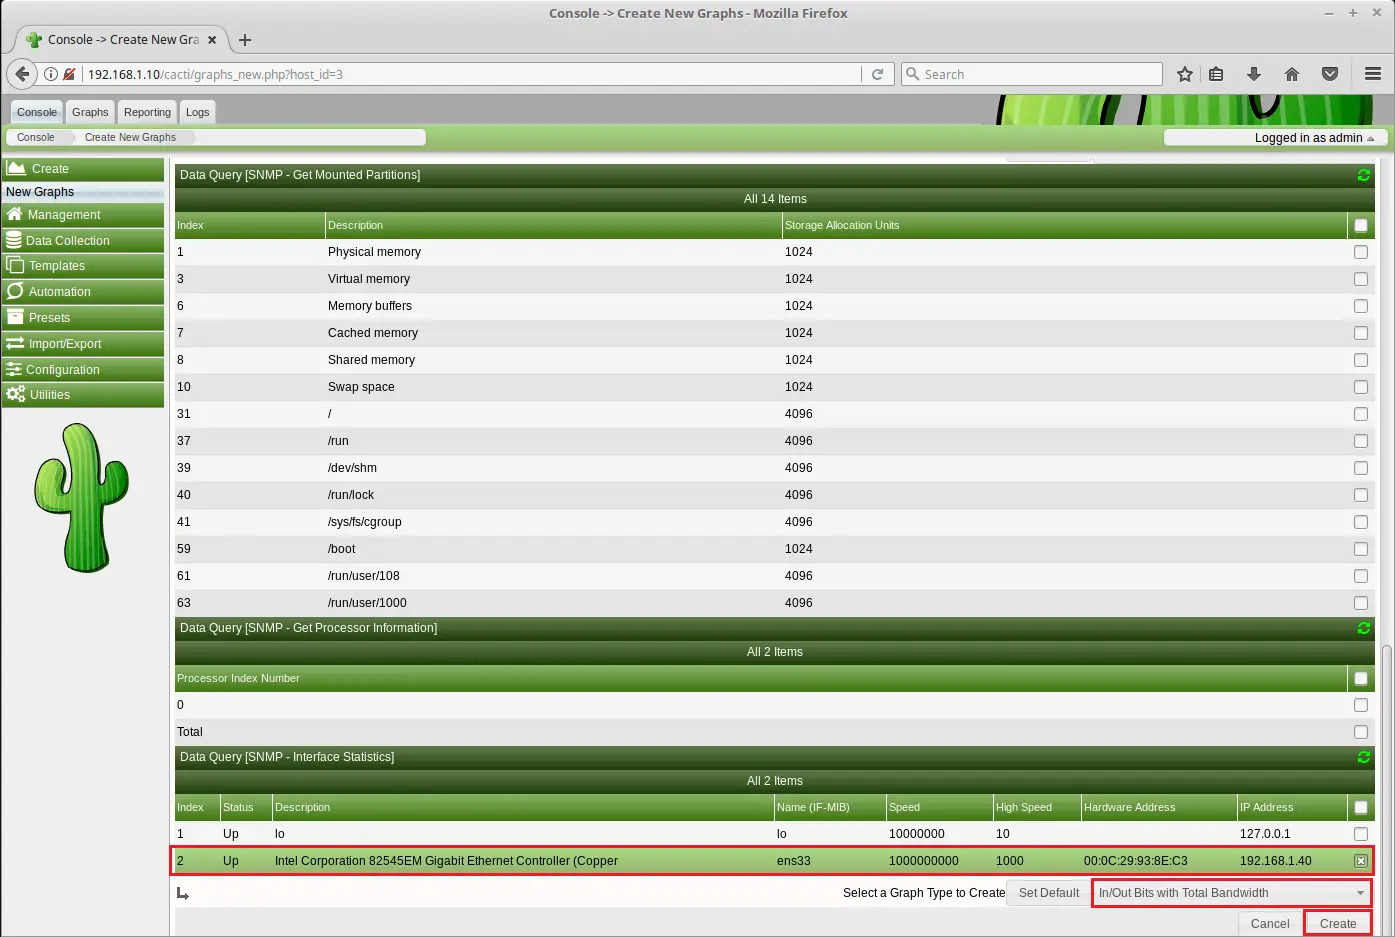
Select the templates depending on your requirements.
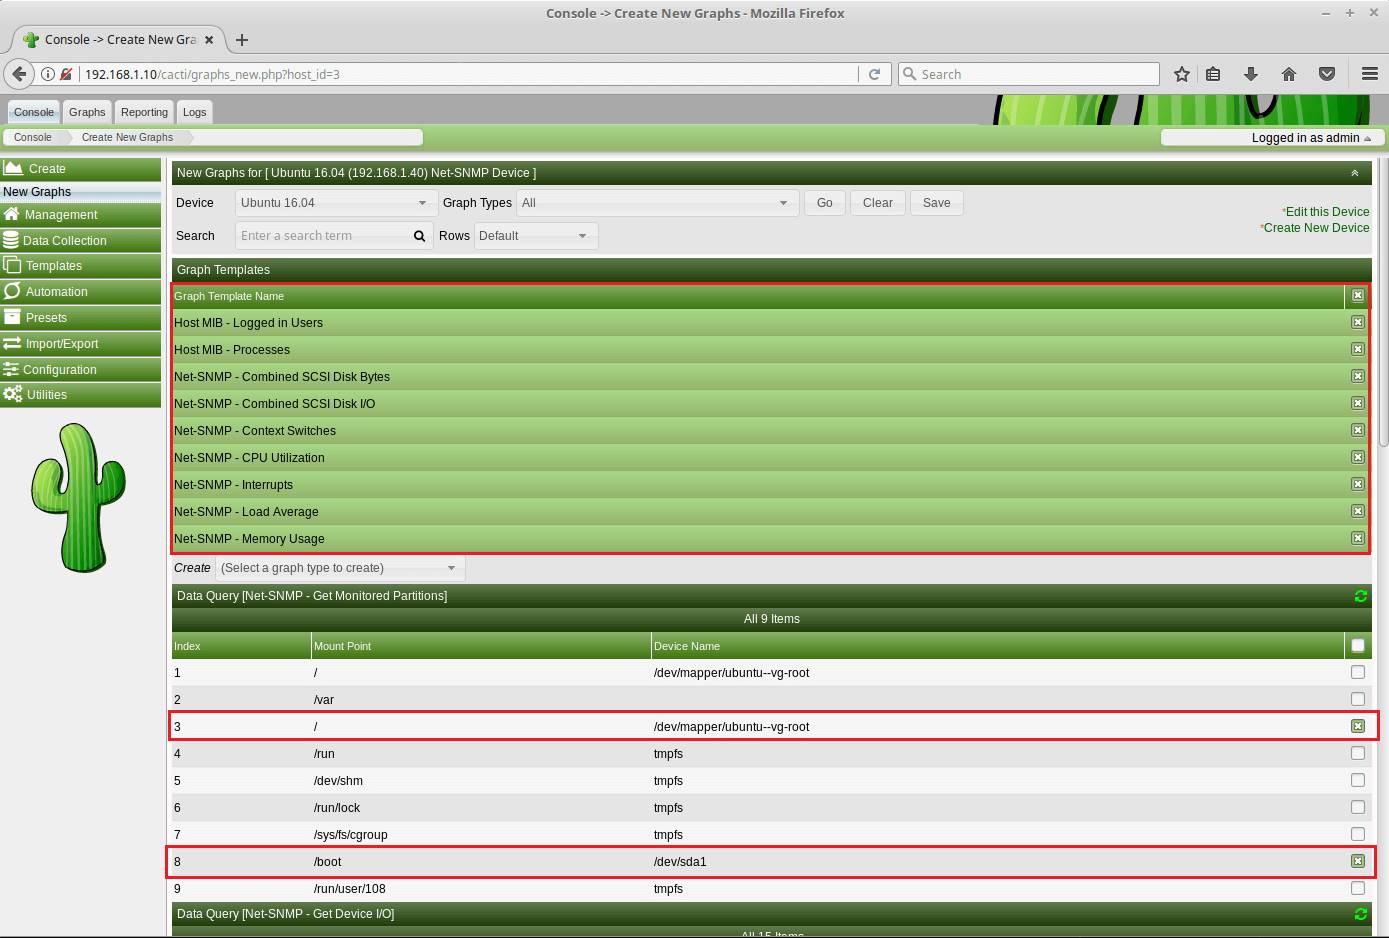
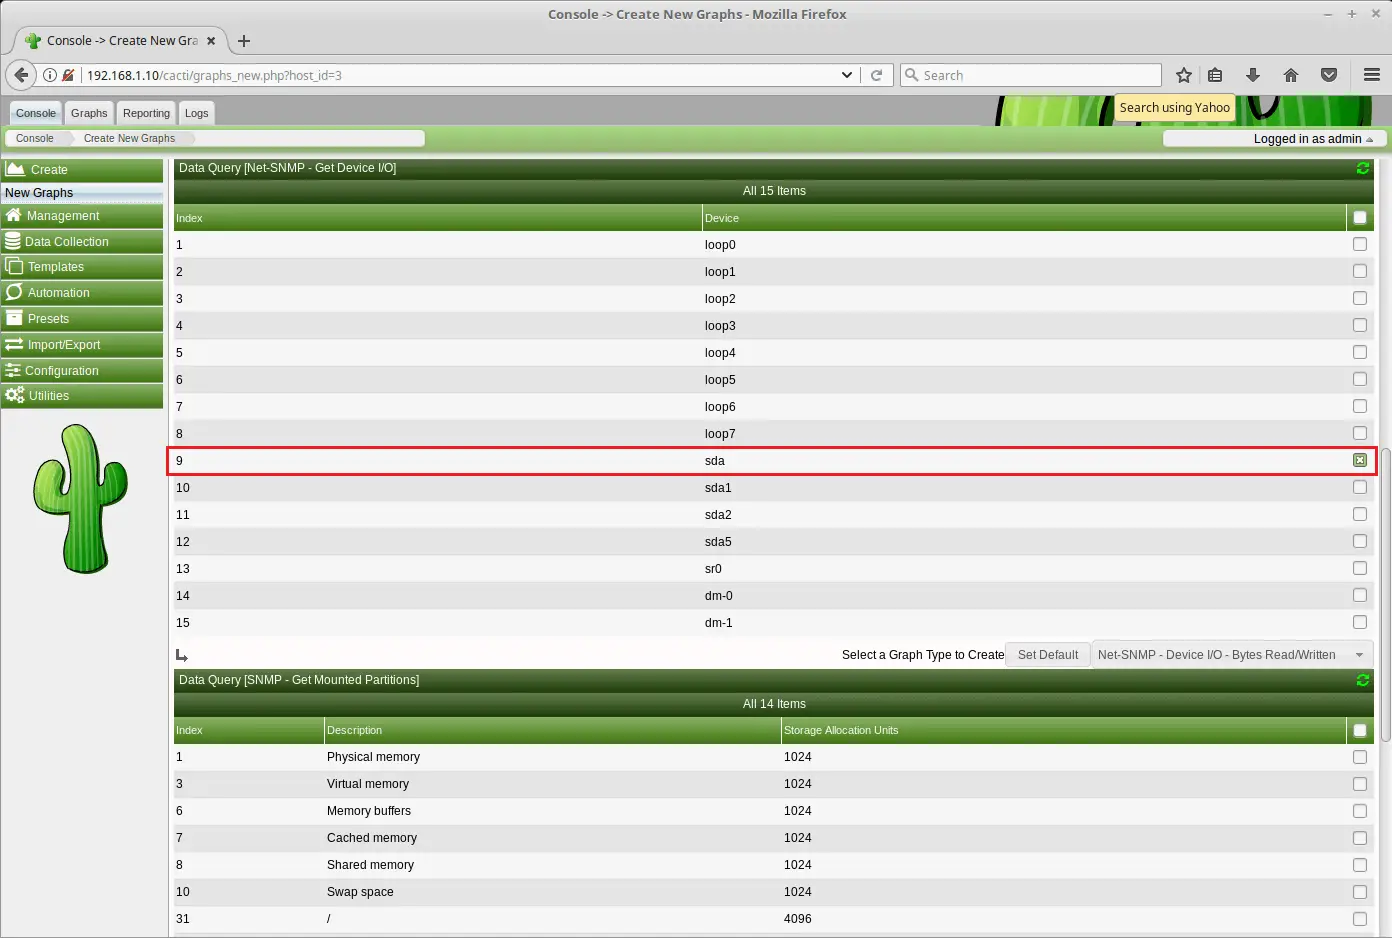
For network interfaces, select a graph type as In/Out Bits with Total Bandwidth and then click on Create.
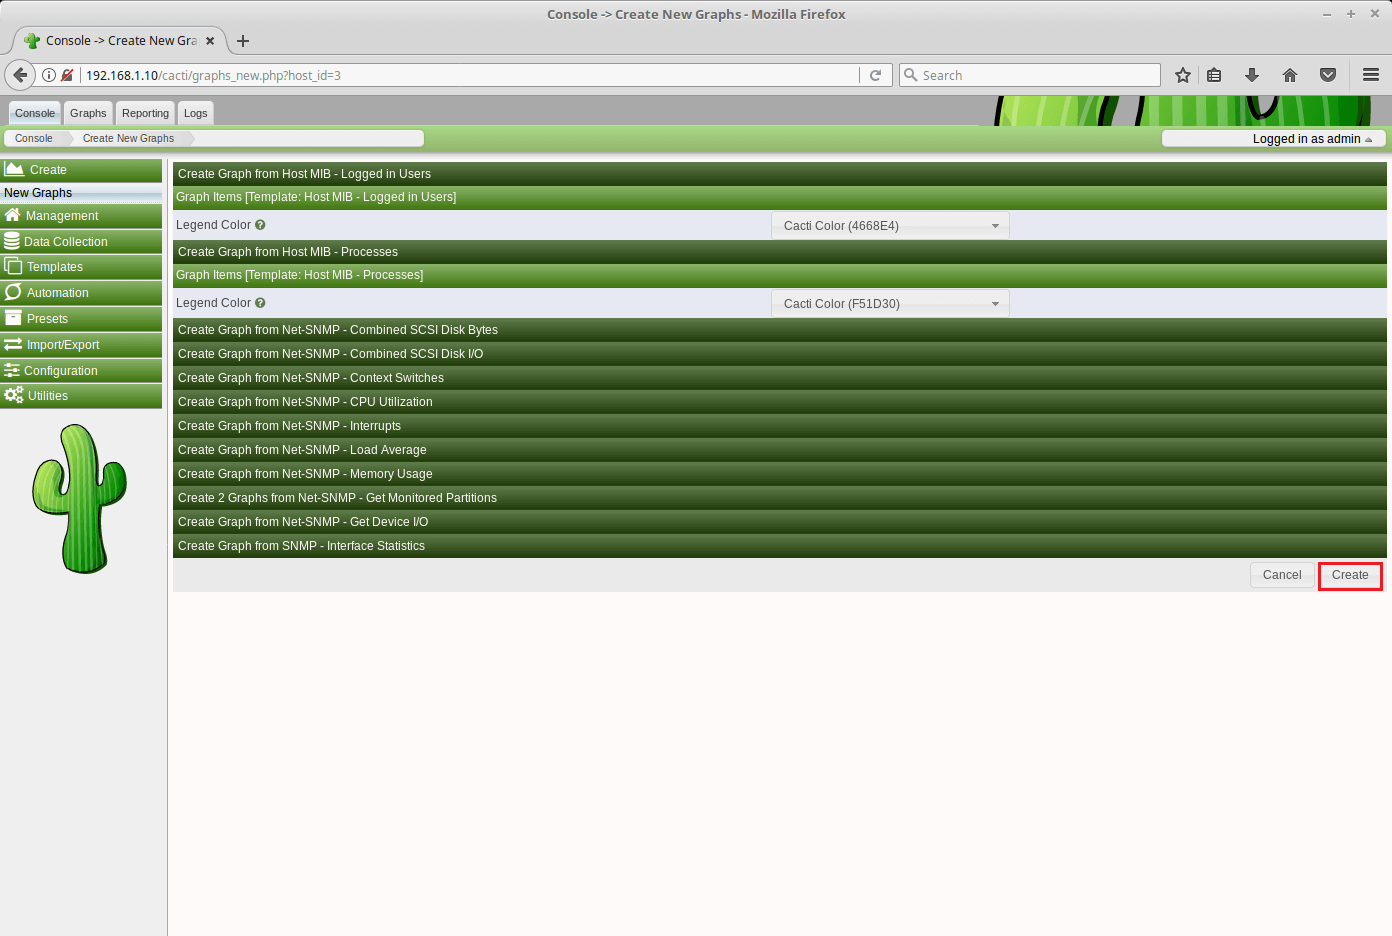
Click Create.
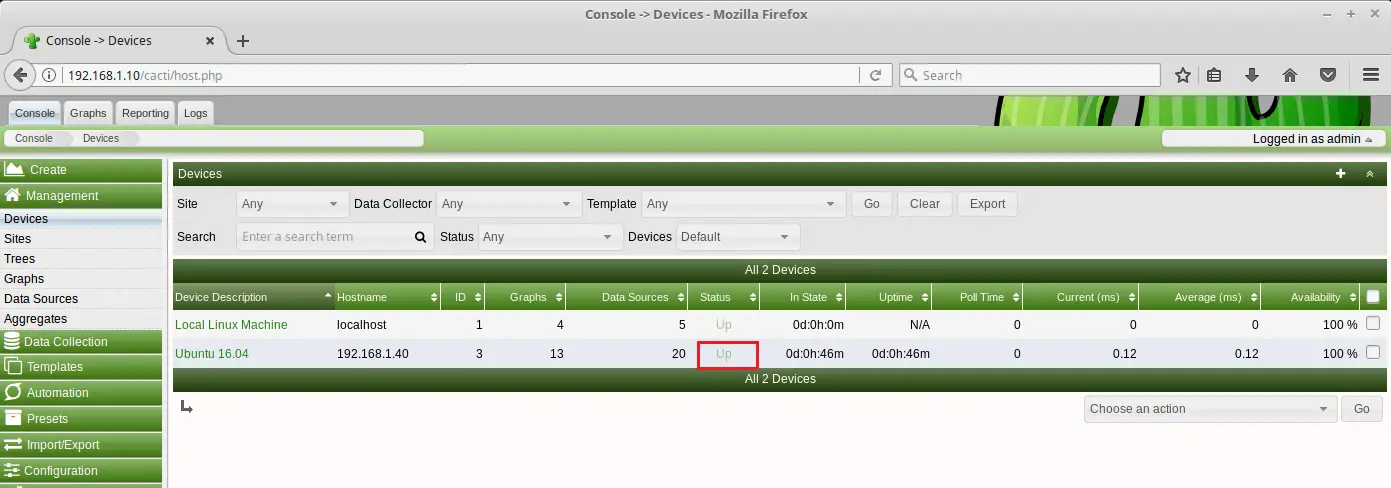
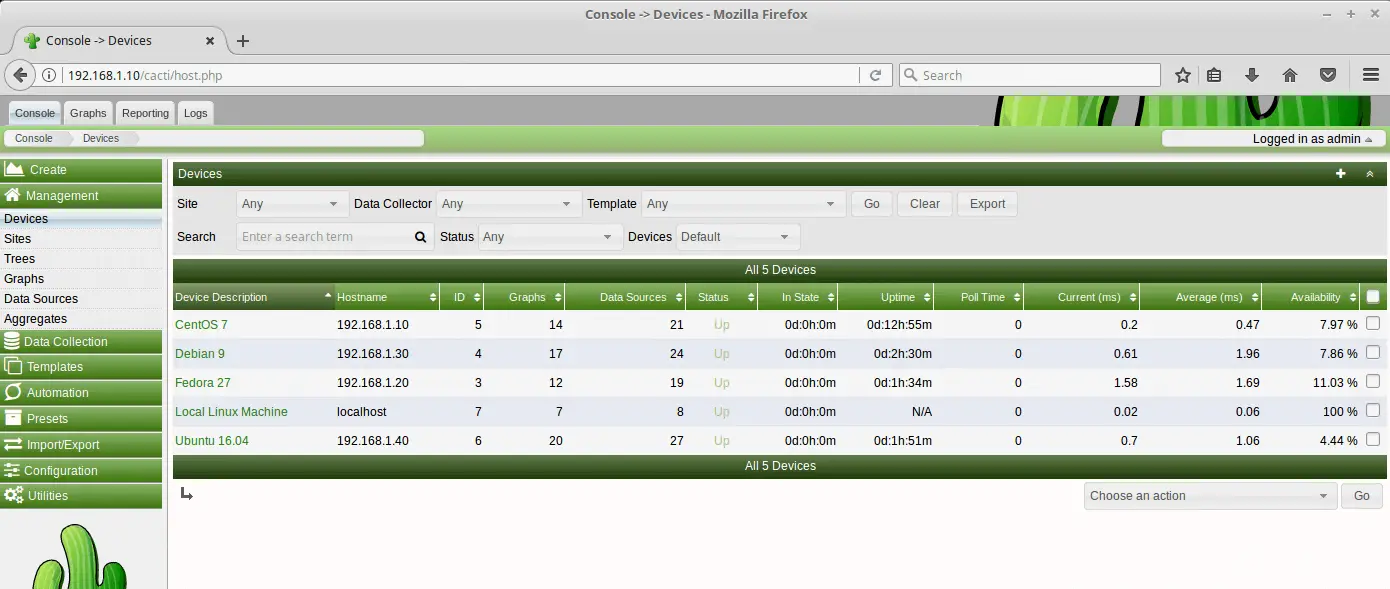
Go to Management >> Devices to check whether the added device is listed or not.
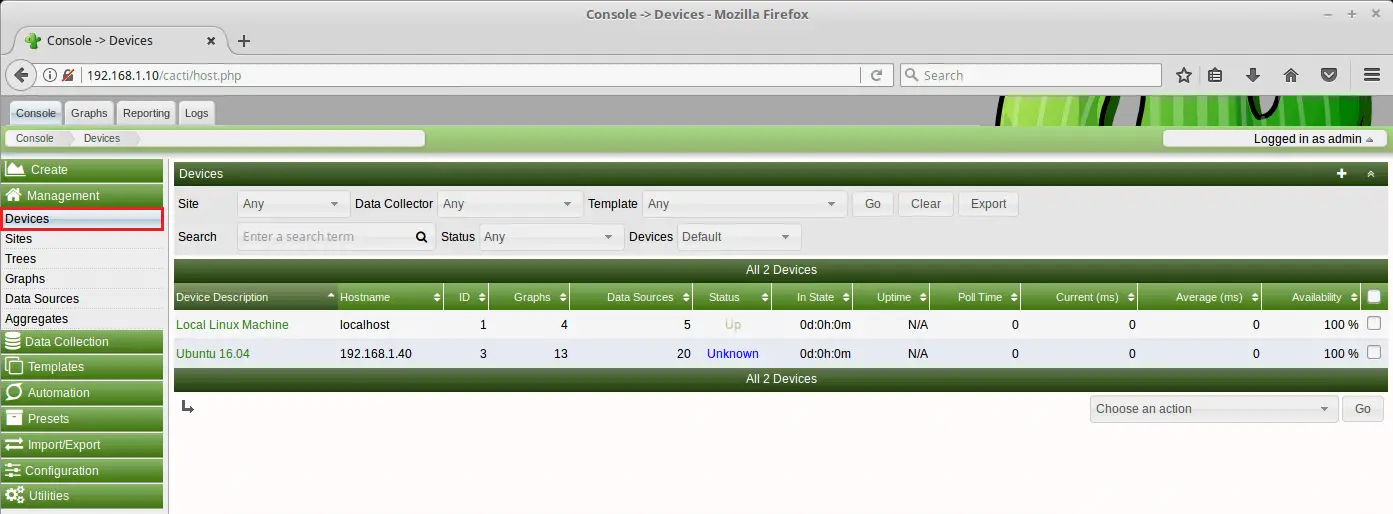
The device status should be up in another 5 minutes (as per poller schedule).
Create Graph Tree
Graph tree is a way of organizing the created graphs and is very useful for managing graphs. Here, we will create a graph tree called “Linux Servers“, and we will put our servers graph into it.
Go to Management >> Graph Trees >> + Sign.
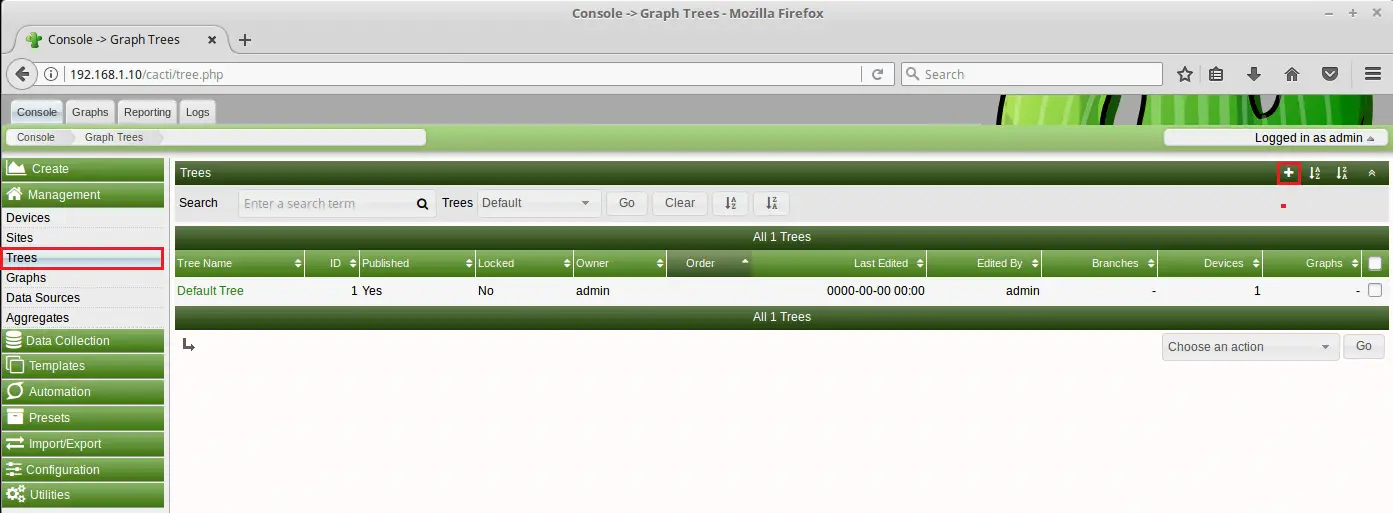
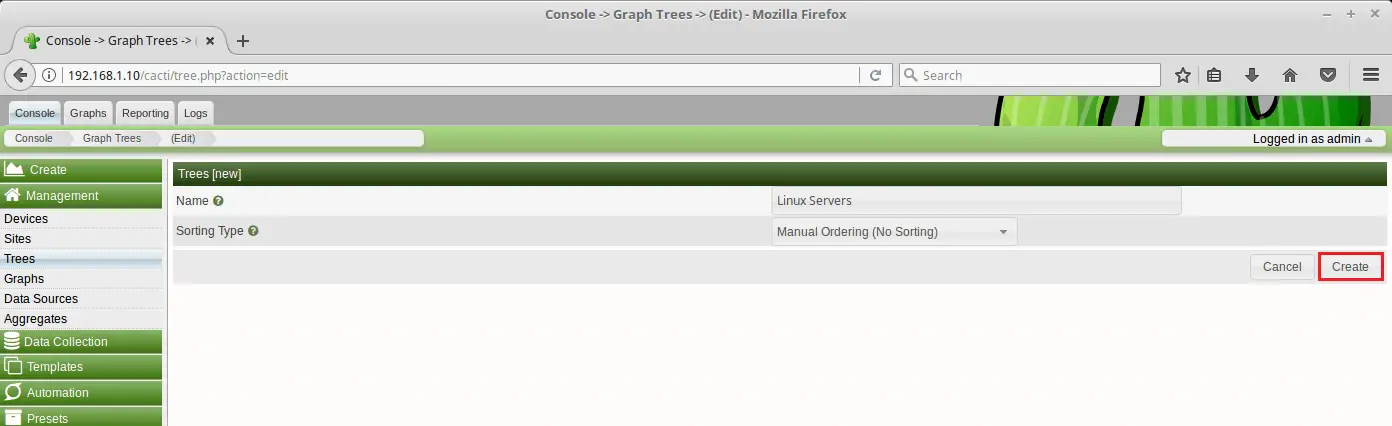
Name it and then click Create.
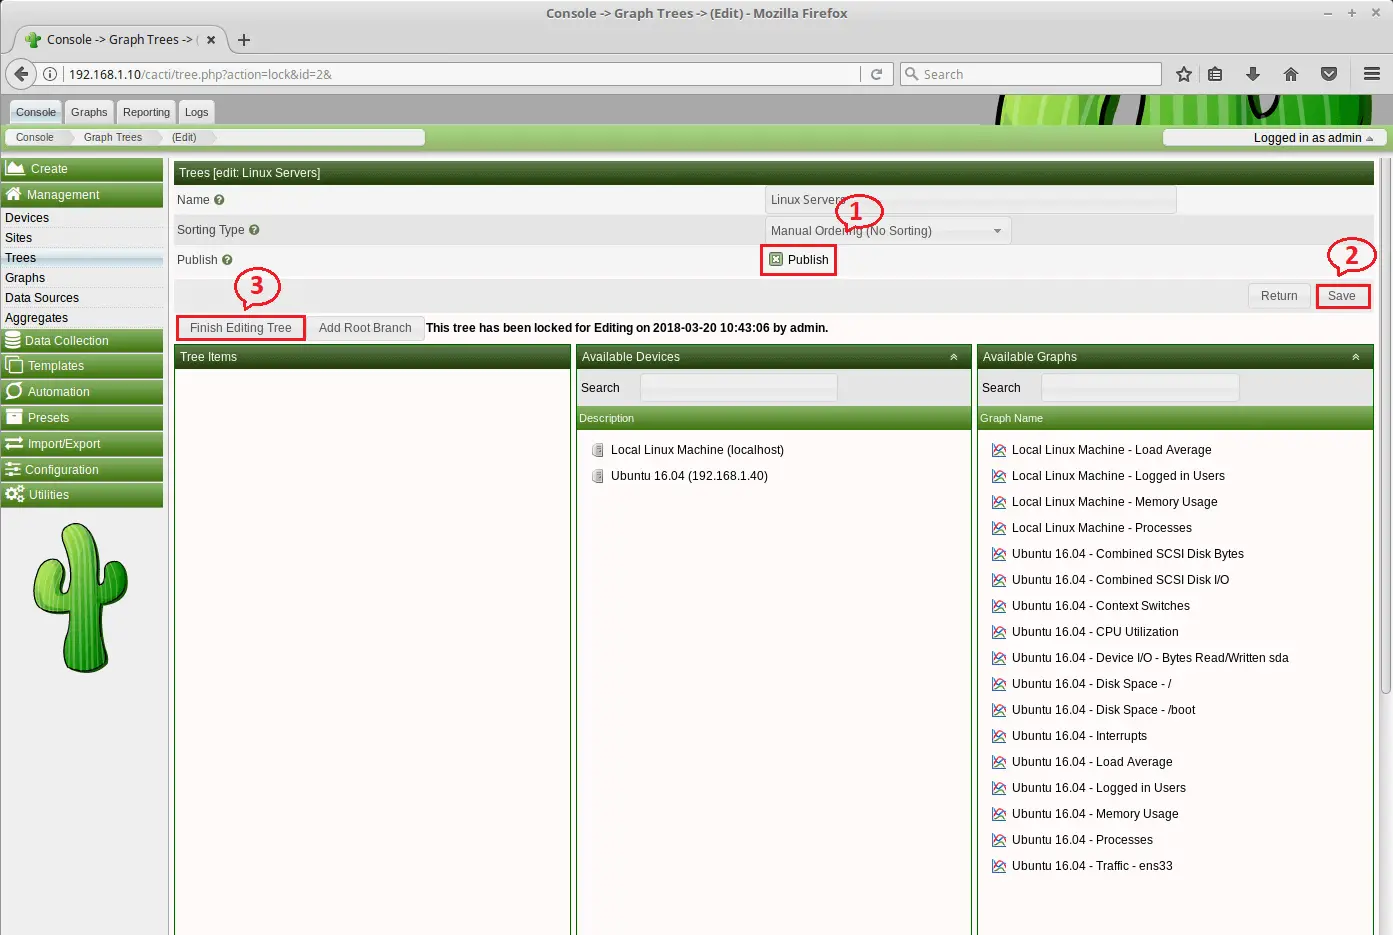
To publish a graph tree, click on Edit Tree.
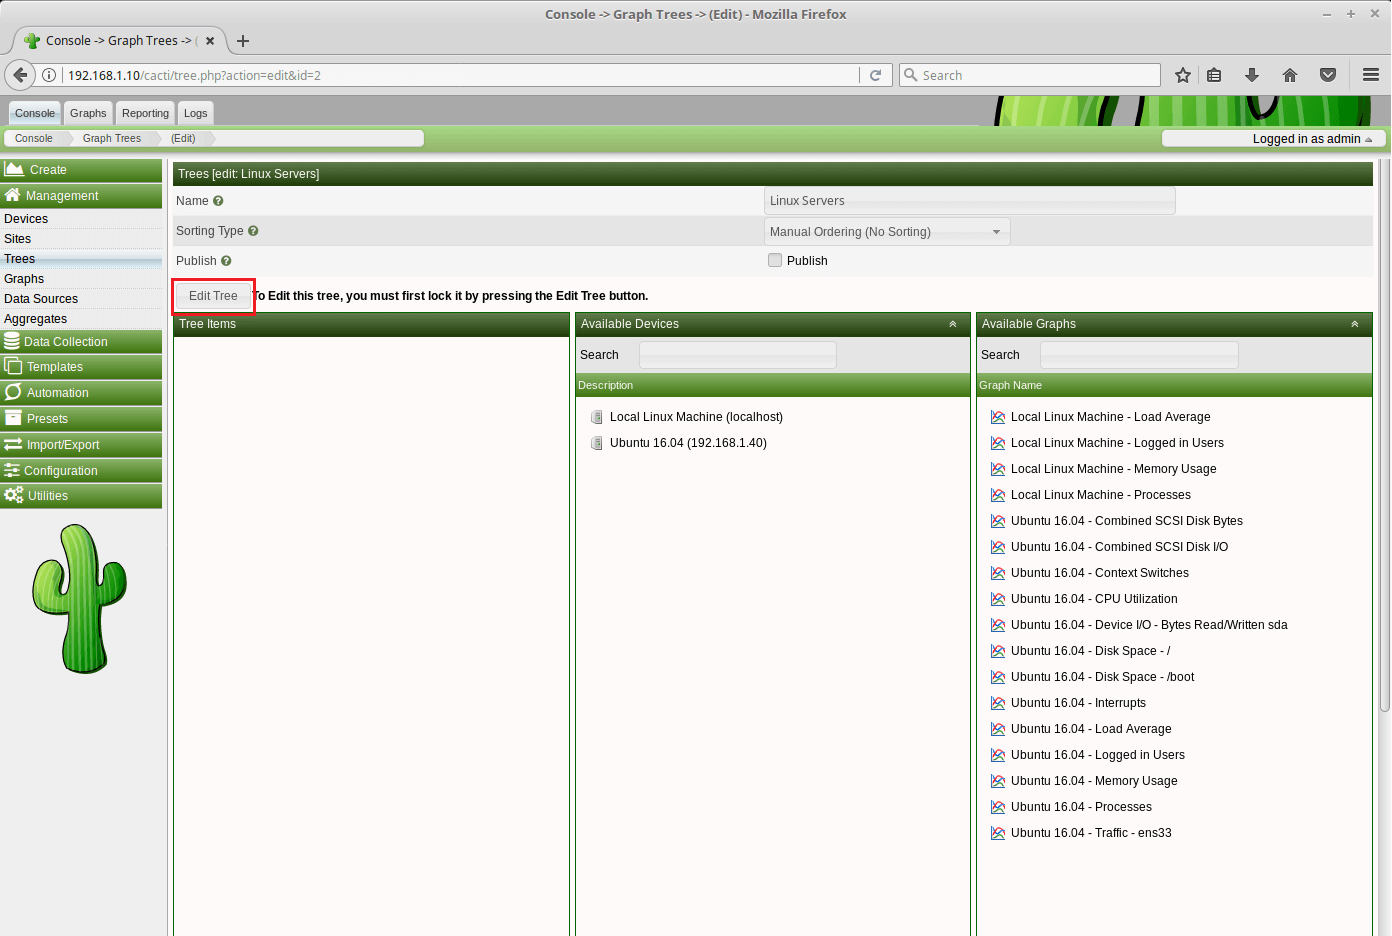
Tick mark the publish and then click Save. Finally, click Finish Editing Tree.
View Graphs
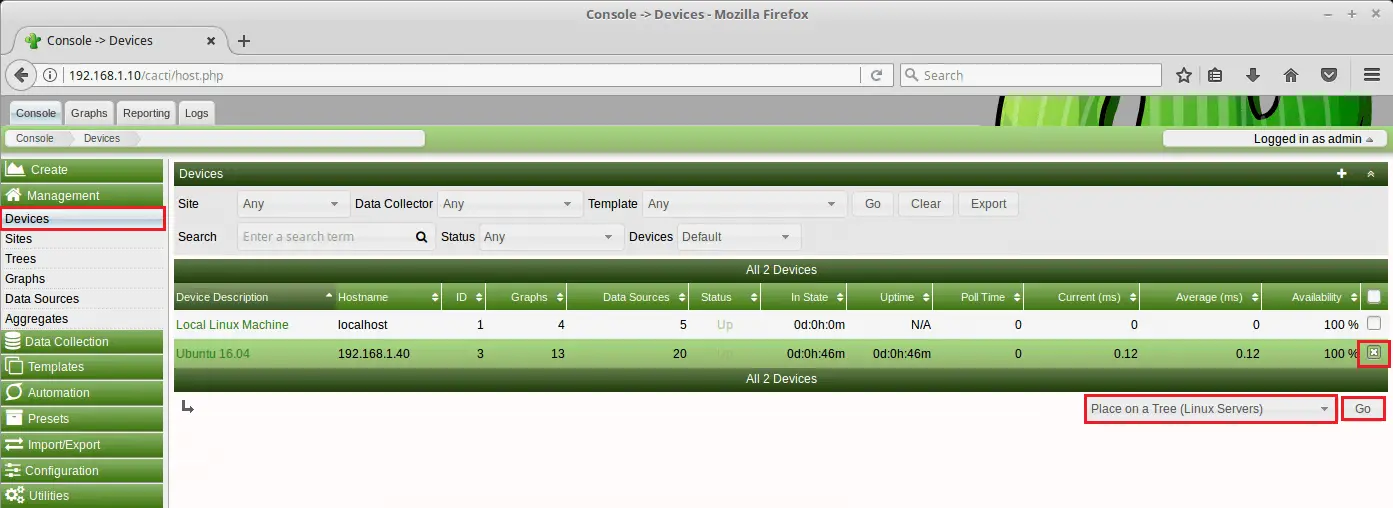
Now, add the newly added device to the created Graph Tree. To do that, go to Management >> Devices >> Select Device >> Place on a Tree (Linux Machines) >> Click Go.
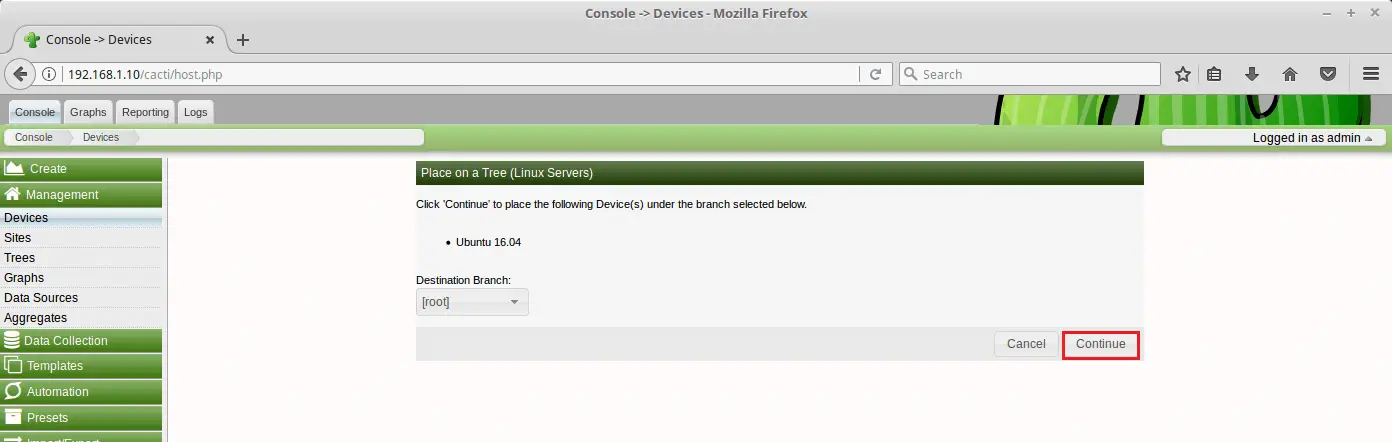
Click Continue on this page.
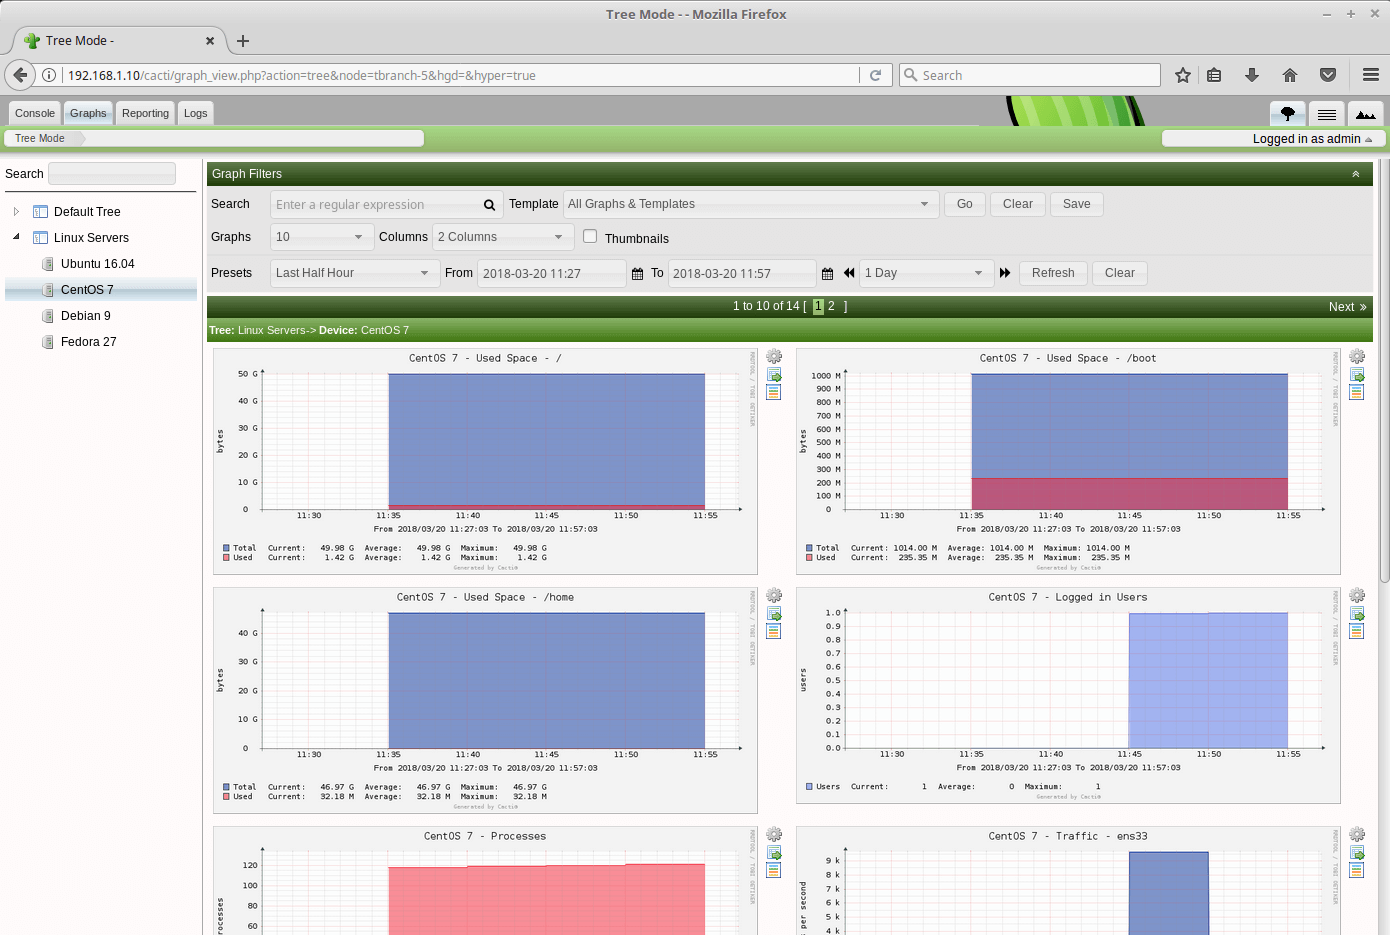
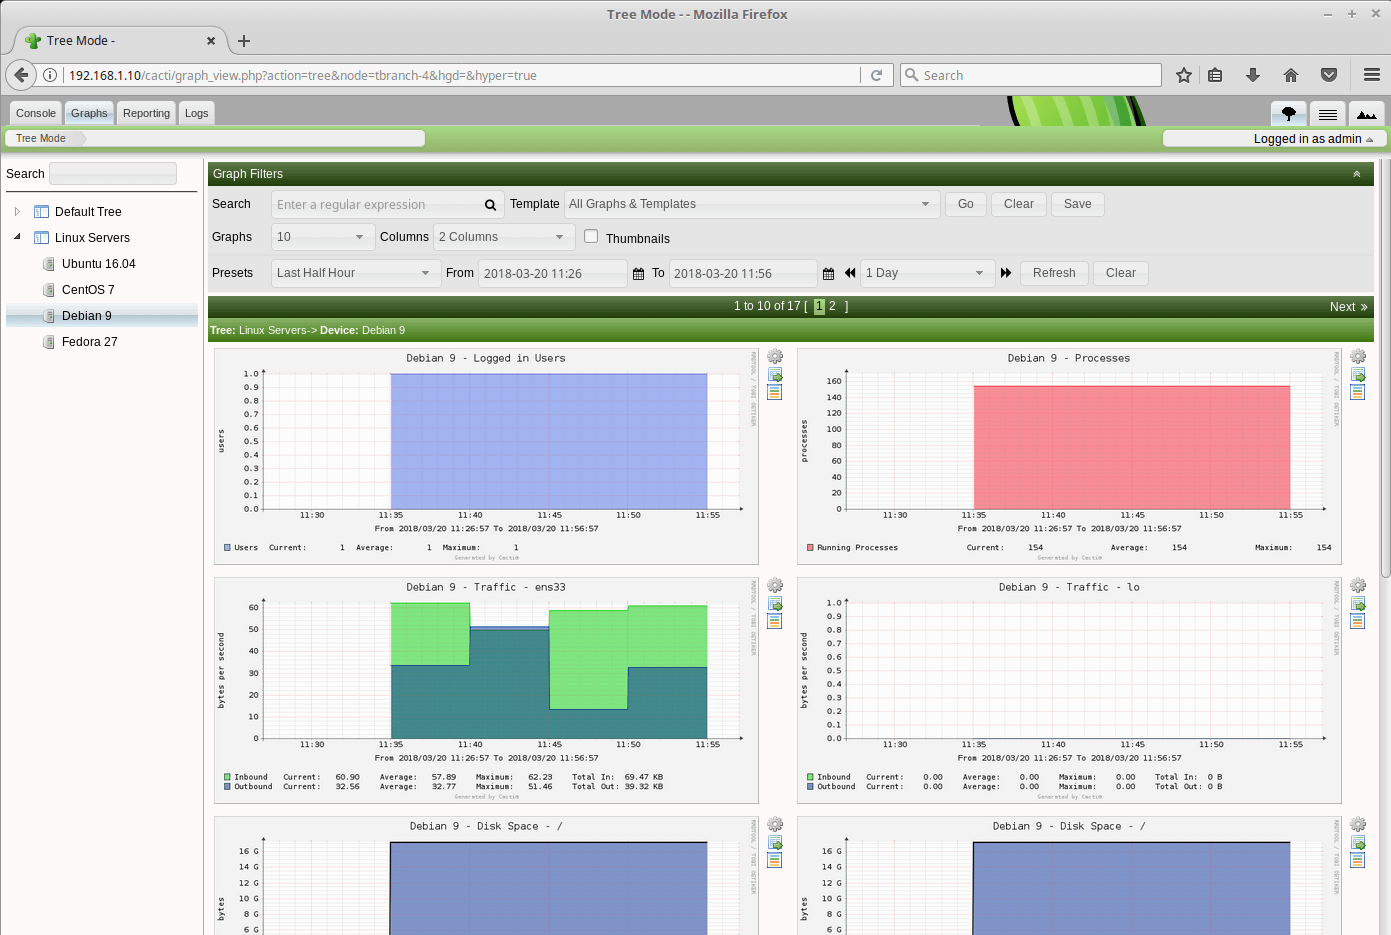
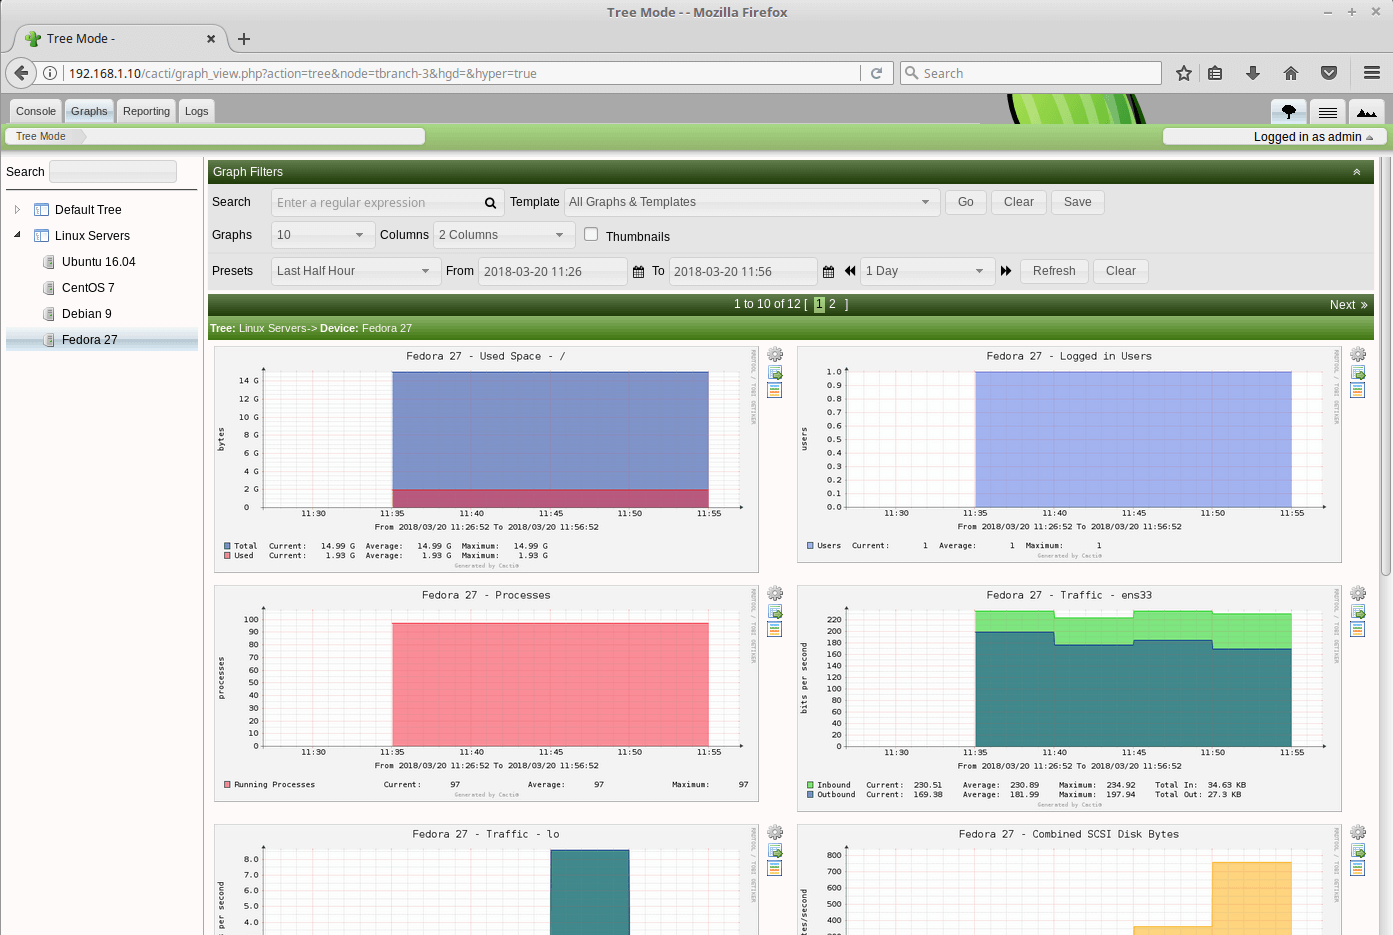
Wait for at least 15 minutes to get meaningful graphs of an added device. To view usage graphs, go to Graphs >> Linux Machines >> Device (Ubuntu 16.04).
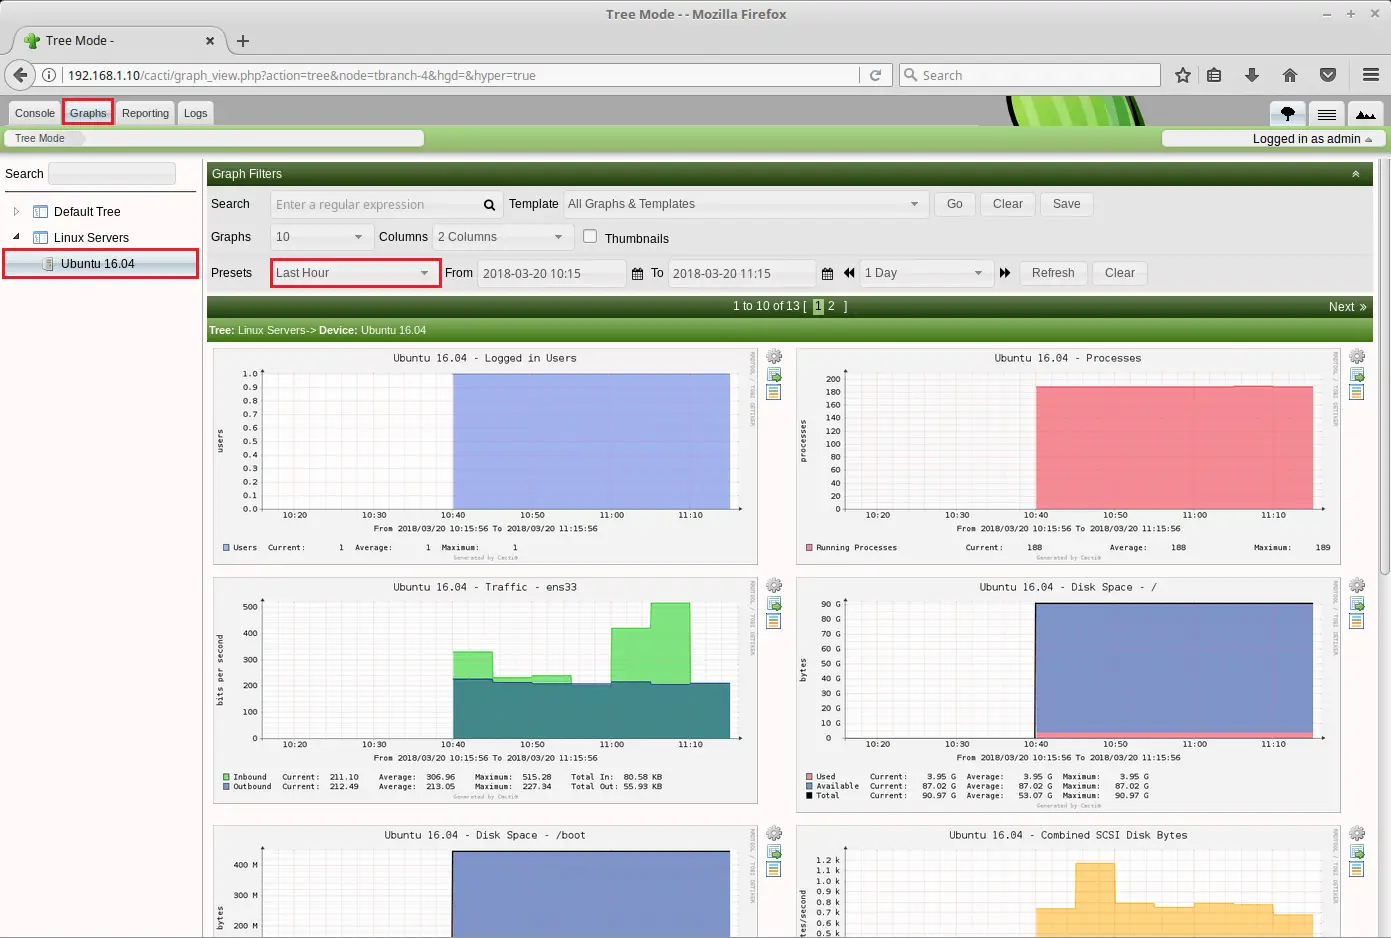
You can see detailed statistics of all metrics like Network Traffic, Running Processes, Users logged in, CPU usage, Memory Usage, Load Average, etc.
Screenshots after adding other devices:
Conclusion: Cacti is a great tool and has maximum capabilities for monitoring servers and network bandwidth. Go and explore all the possibilities of Cacti.
That’s All.